
Create your own report
When a standard report is close but not quite right, build your own and save it to My Reports.
Column properties · sample
- Header
- Cost var %
- Format
- Percent, 2 dp
- Aggregate
- Weighted
- Drill to report
- Weekly variance
See sales, labor, cash, and operating performance across locations. Follow exceptions into the underlying detail so managers know where to focus.
Restaurant locations supported
Hourly workers supported
In restaurant technology
Human-driven support







Choose a workflow and try the examples. All figures are sample data.
Overview
Review sales, transactions, labor, and cash by reporting period, then find the locations that need attention.
| Executive overview | Daily | WTD | PTD | YTD |
|---|---|---|---|---|
| Net sales | $412,380 | $2.21M | $5.02M | $111.4M |
| Transactions | 22,816 | 128,940 | 297,105 | 6.61M |
| Check avg (net) | $18.07 | $17.14 | $16.90 | $16.85 |
| Hourly labor % | 19.2% | 18.4% | 18.9% | 19.8% |
| Cash over/short | −$46 | $118 | $27 | $2,904 |
| Sales comparison | Daily | WTD | PTD | YTD |
|---|---|---|---|---|
| Net sales | $412,380 | $2.21M | $5.02M | $111.4M |
| vs. last year | +3.8% | +4.1% | +3.2% | +2.9% |
| Dine-in | $148,460 | $795.6K | $1.81M | $40.1M |
| Drive-thru | $191,750 | $1.03M | $2.33M | $51.8M |
| Third-party | $72,170 | $386.8K | $878.5K | $19.5M |
| Sales vs. plan | Daily | WTD | PTD | YTD |
|---|---|---|---|---|
| Budgeted sales | $405,000 | $2.17M | $5.10M | $109.8M |
| Actual sales | $412,380 | $2.21M | $5.02M | $111.4M |
| Variance | +$7,380 | +$40K | −$80K | +$1.6M |
| Variance % | +1.8% | +1.8% | −1.6% | +1.5% |
| Cash accountability | Daily | WTD | PTD | YTD |
|---|---|---|---|---|
| Cash sales | $61,420 | $331.5K | $752.9K | $16.7M |
| Deposits | $61,374 | $331.6K | $752.9K | $16.7M |
| Cash over/short | −$46 | $118 | $27 | $2,904 |
| Deletions after total | 1.4% | 1.2% | 1.3% | 1.1% |
| Labor performance | Daily | WTD | PTD | YTD |
|---|---|---|---|---|
| Hourly labor % | 19.2% | 18.4% | 18.9% | 19.8% |
| Labor hours | 8,412 | 45,380 | 103,950 | 2.31M |
| Overtime hours | 96 | 412 | 980 | 21,450 |
| Sales per labor hour | $49.02 | $48.70 | $48.29 | $48.23 |
| Speed of service | Daily | WTD | PTD | YTD |
|---|---|---|---|---|
| Drive-thru total time | 3:24 | 3:31 | 3:29 | 3:36 |
| Order to window | 2:08 | 2:12 | 2:11 | 2:15 |
| Kitchen ticket time | 6:42 | 6:55 | 6:51 | 7:04 |
| Cars over 5 min | 8.6% | 9.4% | 9.1% | 10.2% |
Investigate
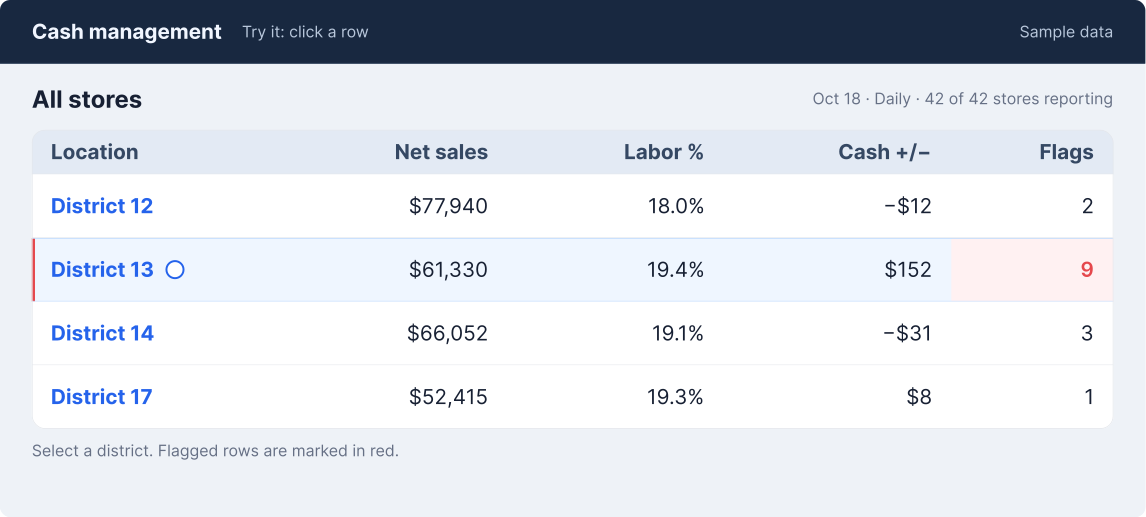
Select a district, store, cashier, and order in this sample investigation.
Insight: labor % has come down about 1.8 points since July and is now below last year.
Visualize
Compare current and prior-year performance. Switch metrics and chart types in the example.
Explore a sample assistant response using the report context. Select a question to see how a summary could support a manager's investigation.
Summarize the main variances in this report.
Three items account for most of this week's variance across the 7 stores:
All other items are within 0.6 points of ideal.
When a standard report is close but not quite right, build your own and save it to My Reports.
Column properties · sample
Set a tolerance per field. Values outside it are marked good or bad and colored. Try it.
| Item | Actual | Ideal | Var |
|---|---|---|---|
| Chicken, portioned | 31.9% | 29.5% | +2.4 |
| Tortilla, 12 in | 3.5% | 4.1% | -0.6 |
| Cheese, shredded | 9.6% | 7.8% | +1.8 |
| Lettuce, shredded | 2.2% | 2.6% | -0.4 |
| Beef, seasoned | 12.4% | 11.3% | +1.1 |
| Sour cream | 1.9% | 1.7% | +0.2 |
3 of 6 items marked Bad at a tolerance of 1.0. Sample data.
Run reports at a set time and send only the exceptions, so the morning report is a short list.
Before we used a spreadsheet where we have to type out manually, now with Altametrics we have a better approach to forecasting, scheduling hours, deployment of labor, who's taking a break when, and effective cross-training.

Since we started using Altametrics, we have been able to get our labor deployment and labor forecasting much more accurate than any prior systems that we've used.

My Hong Kong team can opt to see all their business intelligence reporting in US dollars and that reporting is done on the fly to make it very valuable for the team in that market.

What Altametrics business intelligence is doing for my operators is telling them where they need to put most of their attention. So to me, that is a tool that doesn't exist anywhere else. Everyone should use it.

The food management products are an integral part of how we operate our business. So it's not just restaurant software, it is part of our culture.

Food safety with Altametrics has become much easier which means we can devote more time to helping our guests and seeing their smiles on their faces.

The ability to go in and do the inventory on a weekly basis and do all of our receiving within that system. Also for it to forecast orders out is really starting to make the analytics and the insight into how we better control our cost just improve tenfold.

Sales forecasting has improved greatly since implementing eRestaurant it is much more consistent. It takes the guesswork basically out of evaluation in forecasting.

As a franchise company, we need to know what all the sales are in our stores so Altametrics Business Intelligence was able to develop a system that could get that information for us.

Before we used a spreadsheet where we have to type out manually, now with Altametrics we have a better approach to forecasting, scheduling hours, deployment of labor, who's taking a break when, and effective cross-training.
Since we started using Altametrics, we have been able to get our labor deployment and labor forecasting much more accurate than any prior systems that we've used.
My Hong Kong team can opt to see all their business intelligence reporting in US dollars and that reporting is done on the fly to make it very valuable for the team in that market.
What Altametrics business intelligence is doing for my operators is telling them where they need to put most of their attention. So to me, that is a tool that doesn't exist anywhere else. Everyone should use it.
The food management products are an integral part of how we operate our business. So it's not just restaurant software, it is part of our culture.
Food safety with Altametrics has become much easier which means we can devote more time to helping our guests and seeing their smiles on their faces.
The ability to go in and do the inventory on a weekly basis and do all of our receiving within that system. Also for it to forecast orders out is really starting to make the analytics and the insight into how we better control our cost just improve tenfold.
Sales forecasting has improved greatly since implementing eRestaurant it is much more consistent. It takes the guesswork basically out of evaluation in forecasting.
As a franchise company, we need to know what all the sales are in our stores so Altametrics Business Intelligence was able to develop a system that could get that information for us.
Everything you need to know about the Altametrics platform and our enterprise restaurant management software.