

Overview
A restaurant's menu is one of the most powerful sales tools an owner has, often outperforming advertising or promotions. Every element, from wording to layout, shapes what customers order and how much they spend. Understanding this influence is the first step toward using the menu strategically rather than as a static document.
At its core, the menu guides decision-making. Diners typically scan a menu in under two minutes, influenced by visual hierarchy, item grouping, and the number of choices presented. Too many options overwhelm customers, causing decision fatigue and a retreat to familiar, lower-margin picks. A well-organized menu instead directs attention toward specific items - usually the ones an owner most wants to sell.
Several factors shape these decisions together. Variety affects how focused attention stays on profitable items. Pricing signals value, especially without context or comparison. Descriptions influence appeal - the right language makes a dish sound more premium or craveable. Placement determines visibility, since items in high-attention areas receive more orders.
At its core, the menu guides decision-making. Diners typically scan a menu in under two minutes, influenced by visual hierarchy, item grouping, and the number of choices presented. Too many options overwhelm customers, causing decision fatigue and a retreat to familiar, lower-margin picks. A well-organized menu instead directs attention toward specific items - usually the ones an owner most wants to sell.
Several factors shape these decisions together. Variety affects how focused attention stays on profitable items. Pricing signals value, especially without context or comparison. Descriptions influence appeal - the right language makes a dish sound more premium or craveable. Placement determines visibility, since items in high-attention areas receive more orders.
Add High-Profit Menu Items
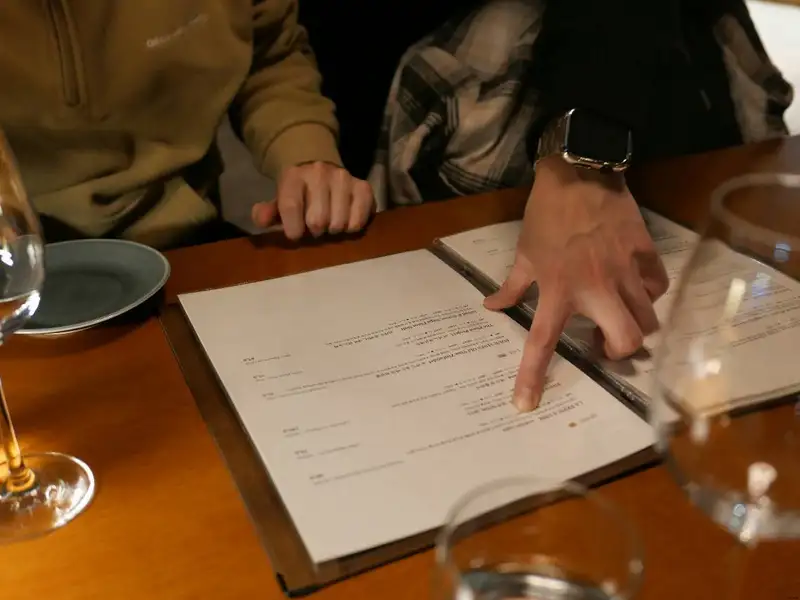
Increasing profitability starts with identifying which menu items generate the strongest returns - not just in raw price, but in actual contribution margin after ingredient costs. A data-driven approach turns this from guesswork into a measurable process.
Start with the core formula -
Contribution Margin = Menu Price - Cost of Goods Sold (COGS) per item
Most full-service restaurants target a food cost percentage between 28% and 35%, meaning a $15 dish should generally cost between $4.20 and $5.25 to produce. Items falling below this range often represent your highest-margin opportunities, while items exceeding it may need reformulation, repricing, or repositioning on the menu.
Identify high-profit items using three data points -
1. Food cost percentage (COGS / menu price x 100) - lower percentages generally indicate stronger margins
2. Contribution margin per dish - the actual dollar amount retained after ingredient costs
3. Order frequency - how often the item is sold relative to other menu items
Cross-referencing these three metrics reveals which dishes are quietly your most profitable, even if they aren't your top sellers by volume.
Maximize ingredient efficiency. Items that share core ingredients across multiple dishes reduce waste, simplify inventory management, and lower per-dish costs. For example, a protein or sauce used in three or four different dishes spreads purchasing costs across more revenue-generating items, improving overall margin without requiring menu price increases. Restaurants that track ingredient overlap often find they can reduce total SKU count by 15-20% while maintaining full menu variety - directly cutting food waste and storage costs.
Balance cost with perceived value. A high-margin item only performs well if customers are willing to pay for it. Compare average order value (AOV) across menu categories to identify where customers already show willingness to spend more - appetizers, specialty entrees, or premium proteins often carry more pricing flexibility than staple items customers judge against competitor pricing.
Track performance over a defined period (30-90 days is standard) before making permanent decisions. Measure -
- Units sold per item
- Contribution margin generated per item
- Percentage of total sales revenue each item represents
Items that combine high margin with steady order volume are strong candidates for increased visibility, while items with high margin but low volume may need better placement, updated descriptions, or slight price adjustments rather than removal.
Start with the core formula -
Contribution Margin = Menu Price - Cost of Goods Sold (COGS) per item
Most full-service restaurants target a food cost percentage between 28% and 35%, meaning a $15 dish should generally cost between $4.20 and $5.25 to produce. Items falling below this range often represent your highest-margin opportunities, while items exceeding it may need reformulation, repricing, or repositioning on the menu.
Identify high-profit items using three data points -
1. Food cost percentage (COGS / menu price x 100) - lower percentages generally indicate stronger margins
2. Contribution margin per dish - the actual dollar amount retained after ingredient costs
3. Order frequency - how often the item is sold relative to other menu items
Cross-referencing these three metrics reveals which dishes are quietly your most profitable, even if they aren't your top sellers by volume.
Maximize ingredient efficiency. Items that share core ingredients across multiple dishes reduce waste, simplify inventory management, and lower per-dish costs. For example, a protein or sauce used in three or four different dishes spreads purchasing costs across more revenue-generating items, improving overall margin without requiring menu price increases. Restaurants that track ingredient overlap often find they can reduce total SKU count by 15-20% while maintaining full menu variety - directly cutting food waste and storage costs.
Balance cost with perceived value. A high-margin item only performs well if customers are willing to pay for it. Compare average order value (AOV) across menu categories to identify where customers already show willingness to spend more - appetizers, specialty entrees, or premium proteins often carry more pricing flexibility than staple items customers judge against competitor pricing.
Track performance over a defined period (30-90 days is standard) before making permanent decisions. Measure -
- Units sold per item
- Contribution margin generated per item
- Percentage of total sales revenue each item represents
Items that combine high margin with steady order volume are strong candidates for increased visibility, while items with high margin but low volume may need better placement, updated descriptions, or slight price adjustments rather than removal.
Simplify Multi-Channel Ordering
Get started with Altametrics to streamline your POS!
Create Combo Meals and Bundled Options
Combo meals and bundled options are among the most direct ways to increase average order value (AOV), since they encourage customers to purchase more items per visit than they might select individually. When designed strategically, bundles feel like added value to the customer while quietly increasing the total check size for the restaurant.
Why bundling works. When items are grouped together at a slightly reduced combined price, customers perceive a discount even if the restaurant maintains a strong margin - because bundled pricing is typically calculated using the highest-margin items as anchors, with lower-cost sides or beverages filling out the package. This makes bundles a reliable way to increase revenue per transaction without necessarily lowering overall profitability.
Pair complementary items thoughtfully. Effective combos pair a core dish with items that naturally enhance it - an entree with a drink and a side, or a sandwich with soup and a small dessert. The goal is to create combinations that feel intuitive rather than forced, so customers see the bundle as a convenient choice rather than an upsell attempt. Beverages are particularly effective additions, since they often carry very low food cost percentages and contribute strong margin to the overall bundle.
Build combos around different dayparts. Bundled options should reflect how customers eat at different times of day -
1. Breakfast combos - entree, side, and coffee or juice
2. Lunch combos - sandwich or entree with a side and drink, often priced for speed and value
3. Dinner combos - entree with appetizer or dessert, positioned around a more relaxed, higher-spend occasion
4. Family-style bundles - larger portions or multiple entrees bundled for group orders, encouraging higher per-visit spend from parties rather than individuals
Each daypart has different customer expectations around price and portion size, so combos should be calibrated accordingly rather than using a single bundling strategy across the entire day.
Use tiered options to guide spending upward. Offering combos in small, medium, and large tiers - or "good, better, best" pricing structures - gives customers a frame of reference. Research on pricing psychology consistently shows that when three tiers are presented, customers gravitate toward the middle option more often than either extreme, making it an effective tier to position higher-margin items or slightly larger portions.
Keep bundles simple to execute operationally. Combos should streamline kitchen workflow, not complicate it. Bundling items that are already prepared using existing ingredients and processes avoids adding new prep steps, keeping ticket times consistent even as order value increases.
When designed around genuine complementary pairings and clear tiered choices, combo meals give customers a sense of value while reliably increasing the size of each transaction.
Why bundling works. When items are grouped together at a slightly reduced combined price, customers perceive a discount even if the restaurant maintains a strong margin - because bundled pricing is typically calculated using the highest-margin items as anchors, with lower-cost sides or beverages filling out the package. This makes bundles a reliable way to increase revenue per transaction without necessarily lowering overall profitability.
Pair complementary items thoughtfully. Effective combos pair a core dish with items that naturally enhance it - an entree with a drink and a side, or a sandwich with soup and a small dessert. The goal is to create combinations that feel intuitive rather than forced, so customers see the bundle as a convenient choice rather than an upsell attempt. Beverages are particularly effective additions, since they often carry very low food cost percentages and contribute strong margin to the overall bundle.
Build combos around different dayparts. Bundled options should reflect how customers eat at different times of day -
1. Breakfast combos - entree, side, and coffee or juice
2. Lunch combos - sandwich or entree with a side and drink, often priced for speed and value
3. Dinner combos - entree with appetizer or dessert, positioned around a more relaxed, higher-spend occasion
4. Family-style bundles - larger portions or multiple entrees bundled for group orders, encouraging higher per-visit spend from parties rather than individuals
Each daypart has different customer expectations around price and portion size, so combos should be calibrated accordingly rather than using a single bundling strategy across the entire day.
Use tiered options to guide spending upward. Offering combos in small, medium, and large tiers - or "good, better, best" pricing structures - gives customers a frame of reference. Research on pricing psychology consistently shows that when three tiers are presented, customers gravitate toward the middle option more often than either extreme, making it an effective tier to position higher-margin items or slightly larger portions.
Keep bundles simple to execute operationally. Combos should streamline kitchen workflow, not complicate it. Bundling items that are already prepared using existing ingredients and processes avoids adding new prep steps, keeping ticket times consistent even as order value increases.
When designed around genuine complementary pairings and clear tiered choices, combo meals give customers a sense of value while reliably increasing the size of each transaction.
Introduce Limited-Time Menu Items
Limited-time offers (LTOs) create urgency, generate excitement, and give customers a reason to visit more frequently - but they need to be introduced strategically to avoid disrupting kitchen efficiency or diluting the core menu.
Why urgency drives sales. Scarcity and time-limited availability are well-documented drivers of purchase behavior. When an item is framed as available "for a limited time" or "while supplies last," customers are more likely to try it immediately rather than delay the decision. Restaurants commonly use LTOs to boost visit frequency during traditionally slower periods, since a compelling seasonal item can motivate a return visit that wouldn't have otherwise happened within that timeframe.
Build LTOs around seasonal ingredients and occasions. Seasonal produce and proteins are often less expensive and higher quality during peak season, which can improve margins on LTOs compared to year-round menu items. Aligning limited-time items with recognizable occasions - holidays, local events, or seasonal transitions - gives the offer built-in relevance and marketing potential without requiring the restaurant to manufacture demand from scratch.
Anchor LTOs to trends and customer interest. Reviewing search trends, social media engagement, and competitor offerings can help identify which flavors, formats, or ingredients are currently generating interest. LTOs that align with existing customer curiosity tend to perform better than items introduced with no external demand signal, since customers arrive already primed to want the item.
Test before making anything permanent. Treat LTOs as a structured trial period rather than a one-off promotion. Track -
1. Units sold per day/week relative to other menu items
2. Attach rate (how often the LTO is ordered alongside other items, indicating impact on overall check size)
3. Repeat orders within the promotional window, as a signal of genuine demand versus novelty
4. Contribution margin, to confirm the item is profitable, not just popular
Items that perform well across these metrics become strong candidates for permanent menu addition; items that generate interest but underperform on margin may need pricing or portion adjustments before being considered further.
Avoid over-complicating operations. Every LTO added introduces new ingredients, prep steps, and potential inventory waste if not carefully planned. A useful guideline is limiting active LTOs to one or two at a time, and avoiding items that require specialized equipment, unique ingredients not used elsewhere on the menu, or significant additional prep labor. Overloading the kitchen with temporary items - even popular ones - can slow ticket times across the entire menu and increase food waste from underused specialty ingredients.
Used deliberately, limited-time items function as a low-risk way to test new concepts, create marketing moments, and drive incremental visits - without committing to permanent menu changes until the data supports it.
Why urgency drives sales. Scarcity and time-limited availability are well-documented drivers of purchase behavior. When an item is framed as available "for a limited time" or "while supplies last," customers are more likely to try it immediately rather than delay the decision. Restaurants commonly use LTOs to boost visit frequency during traditionally slower periods, since a compelling seasonal item can motivate a return visit that wouldn't have otherwise happened within that timeframe.
Build LTOs around seasonal ingredients and occasions. Seasonal produce and proteins are often less expensive and higher quality during peak season, which can improve margins on LTOs compared to year-round menu items. Aligning limited-time items with recognizable occasions - holidays, local events, or seasonal transitions - gives the offer built-in relevance and marketing potential without requiring the restaurant to manufacture demand from scratch.
Anchor LTOs to trends and customer interest. Reviewing search trends, social media engagement, and competitor offerings can help identify which flavors, formats, or ingredients are currently generating interest. LTOs that align with existing customer curiosity tend to perform better than items introduced with no external demand signal, since customers arrive already primed to want the item.
Test before making anything permanent. Treat LTOs as a structured trial period rather than a one-off promotion. Track -
1. Units sold per day/week relative to other menu items
2. Attach rate (how often the LTO is ordered alongside other items, indicating impact on overall check size)
3. Repeat orders within the promotional window, as a signal of genuine demand versus novelty
4. Contribution margin, to confirm the item is profitable, not just popular
Items that perform well across these metrics become strong candidates for permanent menu addition; items that generate interest but underperform on margin may need pricing or portion adjustments before being considered further.
Avoid over-complicating operations. Every LTO added introduces new ingredients, prep steps, and potential inventory waste if not carefully planned. A useful guideline is limiting active LTOs to one or two at a time, and avoiding items that require specialized equipment, unique ingredients not used elsewhere on the menu, or significant additional prep labor. Overloading the kitchen with temporary items - even popular ones - can slow ticket times across the entire menu and increase food waste from underused specialty ingredients.
Used deliberately, limited-time items function as a low-risk way to test new concepts, create marketing moments, and drive incremental visits - without committing to permanent menu changes until the data supports it.
Use Menu Engineering

Menu engineering applies data analysis to menu design, ensuring that the items generating the most value for the business also receive the most visibility to customers. Rather than relying on intuition about what "should" sell well, this approach uses actual sales and cost data to guide layout decisions.
The core framework - popularity vs. profitability. Every menu item can be plotted on a simple matrix using two data points - sales volume (popularity) and contribution margin (profitability). This produces four classic categories -
1. Stars - high popularity, high profitability. These items should receive the most visual prominence.
2. Plow Horses - high popularity, lower profitability. Popular but underpriced or costly; candidates for portion or cost adjustments.
3. Puzzles - high profitability, lower popularity. Strong margin but underordered; often benefit from better placement or description.
4. Dogs - low popularity, low profitability. Typically candidates for removal or reworking.
Calculating each item's category requires two figures - contribution margin per item (price minus COGS) and its percentage of total category sales. Items above the average on both measures are Stars; below average on both are Dogs, with Plow Horses and Puzzles falling on either side.
Give high performers stronger visibility. Once Stars and Puzzles are identified, menu placement should reflect their priority. Eye-tracking studies on printed menus consistently show that customers focus disproportionately on the upper-right section of a page and the first and last items in a list - often referred to as the "golden triangle" or primacy/recency effect. Items placed in these zones typically see measurably higher order rates than identical items placed in the middle of a long list.
Use design elements to direct attention. Boxes, shading, icons, or borders around specific items can increase their order rate, since these visual cues interrupt normal scanning patterns and draw the eye. However, overusing these elements dilutes their effectiveness - a menu with every item highlighted provides no real hierarchy. A general guideline is limiting visual emphasis to no more than 2-3 items per category or page section.
Strengthen descriptions and imagery for Puzzles. Since Puzzle items already carry strong margins but underperform on volume, small changes often shift their performance meaningfully. More descriptive language, a clear callout, or a well-placed photo can increase order rates. In categories where photos are used, items with images have been shown to see notably higher order rates than comparable items without them - though overuse of photography across an entire menu can cheapen its perceived quality, so selective use tends to perform best.
Reassess data periodically. Menu engineering isn't a one-time exercise - as ingredient costs shift and customer preferences change, an item's category can move. Reviewing the popularity/profitability matrix on a recurring basis (quarterly is common) ensures the menu's visual hierarchy continues to reflect current, not outdated, performance data.
The core framework - popularity vs. profitability. Every menu item can be plotted on a simple matrix using two data points - sales volume (popularity) and contribution margin (profitability). This produces four classic categories -
1. Stars - high popularity, high profitability. These items should receive the most visual prominence.
2. Plow Horses - high popularity, lower profitability. Popular but underpriced or costly; candidates for portion or cost adjustments.
3. Puzzles - high profitability, lower popularity. Strong margin but underordered; often benefit from better placement or description.
4. Dogs - low popularity, low profitability. Typically candidates for removal or reworking.
Calculating each item's category requires two figures - contribution margin per item (price minus COGS) and its percentage of total category sales. Items above the average on both measures are Stars; below average on both are Dogs, with Plow Horses and Puzzles falling on either side.
Give high performers stronger visibility. Once Stars and Puzzles are identified, menu placement should reflect their priority. Eye-tracking studies on printed menus consistently show that customers focus disproportionately on the upper-right section of a page and the first and last items in a list - often referred to as the "golden triangle" or primacy/recency effect. Items placed in these zones typically see measurably higher order rates than identical items placed in the middle of a long list.
Use design elements to direct attention. Boxes, shading, icons, or borders around specific items can increase their order rate, since these visual cues interrupt normal scanning patterns and draw the eye. However, overusing these elements dilutes their effectiveness - a menu with every item highlighted provides no real hierarchy. A general guideline is limiting visual emphasis to no more than 2-3 items per category or page section.
Strengthen descriptions and imagery for Puzzles. Since Puzzle items already carry strong margins but underperform on volume, small changes often shift their performance meaningfully. More descriptive language, a clear callout, or a well-placed photo can increase order rates. In categories where photos are used, items with images have been shown to see notably higher order rates than comparable items without them - though overuse of photography across an entire menu can cheapen its perceived quality, so selective use tends to perform best.
Reassess data periodically. Menu engineering isn't a one-time exercise - as ingredient costs shift and customer preferences change, an item's category can move. Reviewing the popularity/profitability matrix on a recurring basis (quarterly is common) ensures the menu's visual hierarchy continues to reflect current, not outdated, performance data.
From Click to Kitchen
Handle All Your Online Orders with Altametrics
Add Upselling and Add-On Options
Upselling and add-on options increase average order value by giving customers relevant ways to enhance a purchase they've already decided to make - a lower-friction sale than convincing someone to order an entirely separate item.
Why add-ons are high-margin by nature. Extras like sauces, toppings, cheese, or premium substitutions typically carry a much lower food cost percentage than full entrees, since they use small portions of ingredients already in inventory. A $1.50-$2.00 add-on with a food cost of $0.30$0.50 often delivers a contribution margin well above 70%, making add-ons one of the most efficient ways to boost per-ticket revenue without adding new SKUs or menu complexity.
Structure add-ons by category -
1. Toppings and sauces - small-cost enhancements to existing dishes (extra cheese, premium sauce, additional protein)
2. Sides - upgrade options from a standard side to a premium one for a modest price difference
3. Desserts - positioned as a natural close to the meal, often prompted directly by staff or menu callouts
4. Beverages - carry some of the highest margins on the menu, making them a priority add-on to suggest
Create upgrade paths for popular dishes. Rather than treating every dish as fixed, identify top-selling items and build in optional upgrades - a protein swap, a size increase, or a premium ingredient substitution. Because these items are already popular, even a modest attach rate (the percentage of orders that include the upgrade) can meaningfully affect total revenue. An attach rate improvement of just 10-15% on a high-volume item can produce a measurable lift in daily sales without any change in traffic.
Design customizable meals with built-in add-on prompts. Build-your-own formats (bowls, sandwiches, pizzas) naturally invite customers to add extra ingredients, but the structure of the customization flow matters. Presenting a small number of relevant, well-priced add-ons at the point of customization tends to outperform an exhaustive list, which can overwhelm customers and reduce overall add-on uptake.
Keep add-on suggestions relevant and limited. Data on choice architecture shows that too many simultaneous options can reduce conversion rather than increase it - a phenomenon sometimes called choice overload. A practical benchmark is offering no more than 3-4 add-on suggestions per item, prioritized by margin and popularity, rather than listing every possible extra.
Train staff to reinforce menu-driven prompts. In-person or phone upselling should mirror what the menu already emphasizes. Suggesting a specific add-on by name (e.g., "Would you like to add a side of garlic bread for $2?") consistently outperforms generic prompts like "Anything else?" - specific suggestions have been shown to significantly increase attach rates compared to open-ended ones, since they reduce the decision-making effort required from the customer.
Tracked consistently, add-on and upsell performance data (attach rate, incremental revenue per ticket, and margin contribution) allows owners to refine which prompts and combinations produce the strongest results over time.
Why add-ons are high-margin by nature. Extras like sauces, toppings, cheese, or premium substitutions typically carry a much lower food cost percentage than full entrees, since they use small portions of ingredients already in inventory. A $1.50-$2.00 add-on with a food cost of $0.30$0.50 often delivers a contribution margin well above 70%, making add-ons one of the most efficient ways to boost per-ticket revenue without adding new SKUs or menu complexity.
Structure add-ons by category -
1. Toppings and sauces - small-cost enhancements to existing dishes (extra cheese, premium sauce, additional protein)
2. Sides - upgrade options from a standard side to a premium one for a modest price difference
3. Desserts - positioned as a natural close to the meal, often prompted directly by staff or menu callouts
4. Beverages - carry some of the highest margins on the menu, making them a priority add-on to suggest
Create upgrade paths for popular dishes. Rather than treating every dish as fixed, identify top-selling items and build in optional upgrades - a protein swap, a size increase, or a premium ingredient substitution. Because these items are already popular, even a modest attach rate (the percentage of orders that include the upgrade) can meaningfully affect total revenue. An attach rate improvement of just 10-15% on a high-volume item can produce a measurable lift in daily sales without any change in traffic.
Design customizable meals with built-in add-on prompts. Build-your-own formats (bowls, sandwiches, pizzas) naturally invite customers to add extra ingredients, but the structure of the customization flow matters. Presenting a small number of relevant, well-priced add-ons at the point of customization tends to outperform an exhaustive list, which can overwhelm customers and reduce overall add-on uptake.
Keep add-on suggestions relevant and limited. Data on choice architecture shows that too many simultaneous options can reduce conversion rather than increase it - a phenomenon sometimes called choice overload. A practical benchmark is offering no more than 3-4 add-on suggestions per item, prioritized by margin and popularity, rather than listing every possible extra.
Train staff to reinforce menu-driven prompts. In-person or phone upselling should mirror what the menu already emphasizes. Suggesting a specific add-on by name (e.g., "Would you like to add a side of garlic bread for $2?") consistently outperforms generic prompts like "Anything else?" - specific suggestions have been shown to significantly increase attach rates compared to open-ended ones, since they reduce the decision-making effort required from the customer.
Tracked consistently, add-on and upsell performance data (attach rate, incremental revenue per ticket, and margin contribution) allows owners to refine which prompts and combinations produce the strongest results over time.
Build Menu Ideas Around Customer Demand
A data-informed menu isn't just engineered for margin - it's built around what customers are actually ordering, avoiding, and asking for. Aligning menu decisions with real demand data reduces the risk of adding items that look appealing on paper but underperform in practice.
Use POS data as the primary source of truth. Point-of-sale systems capture granular, ongoing data on every transaction, making them the most reliable source for identifying genuine demand patterns. Key metrics to track include -
1. Units sold per item, broken down by day of week and time of day
2. Attach rate - how often an item is ordered alongside others
3. Category performance - which sections of the menu (appetizers, entrees, desserts) drive the most revenue
4. Repeat-order rate - how often returning customers reorder the same item, a strong signal of satisfaction
Reviewing this data monthly, rather than relying on anecdotal impressions from staff or owners, tends to surface patterns that aren't otherwise obvious - such as an item quietly underperforming despite seeming popular in daily service.
Factor in seasonal and cyclical demand. Year-over-year POS data often reveals predictable seasonal shifts - lighter dishes gaining traction in warmer months, heartier items rising in colder ones, or specific items spiking around holidays. Layering this seasonal view on top of raw sales totals prevents misreading a temporary dip or spike as a long-term trend.
Identify underperforming items using clear thresholds. A common benchmark is flagging any item that falls below 1-2% of total category sales over a 90-day period for review. Items consistently below this threshold, especially when paired with low or negative contribution margin, are strong candidates for removal - freeing up kitchen capacity and menu space for better-performing options. Removing low performers also simplifies inventory, which can reduce food waste and prep time across the board.
Incorporate direct customer feedback. POS data shows what customers order, but not always why. Comment cards, online reviews, social media mentions, and direct requests provide qualitative context - revealing dishes customers wish existed, ingredients they'd like added, or recurring complaints about existing items. Cross-referencing this feedback with sales data helps distinguish between items that are underperforming due to low demand versus items that are simply positioned, described, or priced poorly.
Test new ideas incrementally. Rather than making sweeping menu changes based on assumptions, new items informed by customer demand should ideally be introduced as limited-time offers first, allowing real sales data to validate demand before a permanent commitment is made.
Building the menu around measurable customer demand - rather than owner preference or industry trend alone - creates a feedback loop where the menu continuously adapts to what's actually driving visits and revenue.
Use POS data as the primary source of truth. Point-of-sale systems capture granular, ongoing data on every transaction, making them the most reliable source for identifying genuine demand patterns. Key metrics to track include -
1. Units sold per item, broken down by day of week and time of day
2. Attach rate - how often an item is ordered alongside others
3. Category performance - which sections of the menu (appetizers, entrees, desserts) drive the most revenue
4. Repeat-order rate - how often returning customers reorder the same item, a strong signal of satisfaction
Reviewing this data monthly, rather than relying on anecdotal impressions from staff or owners, tends to surface patterns that aren't otherwise obvious - such as an item quietly underperforming despite seeming popular in daily service.
Factor in seasonal and cyclical demand. Year-over-year POS data often reveals predictable seasonal shifts - lighter dishes gaining traction in warmer months, heartier items rising in colder ones, or specific items spiking around holidays. Layering this seasonal view on top of raw sales totals prevents misreading a temporary dip or spike as a long-term trend.
Identify underperforming items using clear thresholds. A common benchmark is flagging any item that falls below 1-2% of total category sales over a 90-day period for review. Items consistently below this threshold, especially when paired with low or negative contribution margin, are strong candidates for removal - freeing up kitchen capacity and menu space for better-performing options. Removing low performers also simplifies inventory, which can reduce food waste and prep time across the board.
Incorporate direct customer feedback. POS data shows what customers order, but not always why. Comment cards, online reviews, social media mentions, and direct requests provide qualitative context - revealing dishes customers wish existed, ingredients they'd like added, or recurring complaints about existing items. Cross-referencing this feedback with sales data helps distinguish between items that are underperforming due to low demand versus items that are simply positioned, described, or priced poorly.
Test new ideas incrementally. Rather than making sweeping menu changes based on assumptions, new items informed by customer demand should ideally be introduced as limited-time offers first, allowing real sales data to validate demand before a permanent commitment is made.
Building the menu around measurable customer demand - rather than owner preference or industry trend alone - creates a feedback loop where the menu continuously adapts to what's actually driving visits and revenue.
Measure Menu Performance and Make Adjustments
A menu should never be treated as a finished product - it's an evolving tool that requires ongoing measurement to stay aligned with costs, customer preferences, and profitability goals. Establishing a consistent review process turns menu management into a data-driven cycle rather than a one-time design decision.
Track the core performance metrics. At minimum, an effective review process should monitor -
1. Food cost percentage per item (COGS / menu price x 100), with 28-35% as a general industry benchmark
2. Contribution margin per item, to identify which dishes generate the most actual profit
3. Units sold per item, segmented by day, week, and season
4. Average check size, to measure whether combo, upsell, and pricing strategies are increasing per-visit spend
5. Category-level sales mix, showing what percentage of total revenue each menu section contributes
Tracking these metrics together - rather than in isolation - prevents misleading conclusions, since a high-volume item with poor margin can look successful on sales reports while quietly underperforming on profitability.
Compare performance over defined time periods. Reviewing data on a monthly and quarterly basis allows owners to distinguish between short-term fluctuations and genuine trends. Year-over-year comparisons are particularly useful for accounting for seasonality, ensuring a slow month isn't mistaken for a failing item when it's simply following a predictable seasonal pattern.
Run controlled tests on specific variables. Rather than changing multiple elements at once, isolate individual variables to measure their true impact -
1. Pricing tests - adjusting price in small increments (often 3-5%) to measure the effect on order volume and overall margin
2. Description tests - rewriting an item's description to include more sensory or descriptive language, then comparing order rates before and after
3. Portion tests - adjusting portion size to assess impact on both cost and customer satisfaction
4. Placement tests - moving an item to a higher-visibility position (per Section 5's menu engineering principles) and tracking any change in order frequency
Testing one variable at a time over a consistent measurement window (typically 30-60 days) produces clearer, more actionable data than making several changes simultaneously.
Track the core performance metrics. At minimum, an effective review process should monitor -
1. Food cost percentage per item (COGS / menu price x 100), with 28-35% as a general industry benchmark
2. Contribution margin per item, to identify which dishes generate the most actual profit
3. Units sold per item, segmented by day, week, and season
4. Average check size, to measure whether combo, upsell, and pricing strategies are increasing per-visit spend
5. Category-level sales mix, showing what percentage of total revenue each menu section contributes
Tracking these metrics together - rather than in isolation - prevents misleading conclusions, since a high-volume item with poor margin can look successful on sales reports while quietly underperforming on profitability.
Compare performance over defined time periods. Reviewing data on a monthly and quarterly basis allows owners to distinguish between short-term fluctuations and genuine trends. Year-over-year comparisons are particularly useful for accounting for seasonality, ensuring a slow month isn't mistaken for a failing item when it's simply following a predictable seasonal pattern.
Run controlled tests on specific variables. Rather than changing multiple elements at once, isolate individual variables to measure their true impact -
1. Pricing tests - adjusting price in small increments (often 3-5%) to measure the effect on order volume and overall margin
2. Description tests - rewriting an item's description to include more sensory or descriptive language, then comparing order rates before and after
3. Portion tests - adjusting portion size to assess impact on both cost and customer satisfaction
4. Placement tests - moving an item to a higher-visibility position (per Section 5's menu engineering principles) and tracking any change in order frequency
Testing one variable at a time over a consistent measurement window (typically 30-60 days) produces clearer, more actionable data than making several changes simultaneously.
Streamline Operations
Control Menus, Items, and Prices Seamlessly with Altametrics
Frequently
Asked Questions
What are the most profitable menu items for restaurants?
The most profitable items typically combine strong customer demand with manageable ingredient costs, efficient preparation, and attractive pricing.
How can a restaurant menu increase average order value?
Restaurants can increase average order value by offering meal bundles, premium upgrades, complementary sides, beverages, desserts, and relevant add-ons.
What are good limited-time menu ideas for restaurants?
Seasonal dishes, holiday specials, new flavor combinations, themed meals, and promotional bundles can work well as limited-time menu offerings.
How can menu engineering increase restaurant sales?
Menu engineering analyzes item popularity and profitability to determine which dishes should receive greater visibility, promotional emphasis, or pricing adjustments.
Must-Read Content
How to Manage Tasks in a Restaurant
Learn how to manage tasks in a restaurant by organizing responsibilities, prioritizing duties, assigning employees, tracking progress, and using technology effectively.
The Complete Guide to Restaurant Reputation Management
Restaurant reputation management helps restaurant owners monitor reviews, respond to feedback, improve customer experiences, protect their reputation, and build trust.

How Much Should a Restaurant Spend on Marketing?
Restaurants should base how much to spend on marketing on revenue, growth stage, size, and specific business goals.