Understand What Liquor Cost Means
Liquor cost percentage represents the relationship between what you spend on liquor inventory and what that liquor generates in sales. If you spend $20 in liquor to generate $100 in liquor sales, your liquor cost is 20%. This single metric compresses a huge amount of operational information - purchasing, pouring, pricing, waste, and even theft into one number you can track over time.
It's worth distinguishing this from a few related terms that often get confused -
1. Liquor cost % - cost of liquor sold divided by liquor sales revenue (the focus of this guide)
2. Pour cost - often used interchangeably with liquor cost, though some operators apply it more narrowly to a single drink or pour
3. Markup - the inverse relationship, showing how much you're charging relative to cost
Liquor sales are typically one of the highest-margin categories in a restaurant, often outperforming food in profitability. That makes liquor cost percentage a powerful lever small shifts in this number can have an outsized effect on overall profitability. A restaurant that lets liquor cost creep up by even a few percentage points can lose thousands of dollars a month without any single dramatic incident causing it. It's rarely one big theft or one bad shift; it's usually a slow accumulation of over-pouring, inconsistent recipes, and untracked waste.
While the "right" liquor cost varies by concept, service style, and region, most full-service restaurants and bars aim for a liquor cost percentage between 18% and 24%. Higher-volume bars with strong negotiating power on purchasing may push toward the lower end of that range, while restaurants with a smaller, curated liquor program might run slightly higher. The key isn't hitting an exact industry number - it's understanding what's normal for your operation and catching deviations quickly.
The Liquor Cost Formula

The Core Formula
Liquor cost percentage is calculated as -
(Beginning Inventory + Purchases - Ending Inventory) / Liquor Sales x 100
This formula gives you the cost of liquor actually used (or "sold") during a given period, then expresses that cost as a percentage of the revenue it generated.
Breaking Down Each Variable
1. Beginning Inventory - The dollar value of all liquor on hand at the start of your chosen period, valued at cost (not retail price).
2. Purchases - The total cost of all liquor bought during the period, based on supplier invoices. This should reflect what you actually paid, including any relevant taxes or fees your accounting treats as part of cost.
3. Ending Inventory - The dollar value of all liquor on hand at the close of the period, again valued at cost.
4. Liquor Sales - Total revenue generated from liquor sales during the same period, pulled from your POS system.
The numerator (Beginning Inventory + Purchases - Ending Inventory) represents your Cost of Goods Sold (COGS) for liquor. It answers the question - "How much liquor, in dollar terms, did we actually use up during this period?" Dividing that by sales tells you what portion of your revenue went toward the product itself.
A Quick Illustrative Example
Suppose you start the month with $10,000 in liquor inventory, purchase $8,000 more during the month, and end the month with $9,000 in inventory. Your liquor COGS would be -
$10,000 + $8,000 - $9,000 = $9,000
If your liquor sales for that same month totaled $45,000, your liquor cost percentage would be -
$9,000 / $45,000 x 100 = 20%
Liquor Cost % vs. Pour Cost vs. Markup
These three terms are related but not always identical in practice -
- Liquor cost % (as defined above) is typically calculated at the aggregate level - across a full bar program or period - using inventory and sales data.
- Pour cost is sometimes used to describe the cost percentage of a single drink, calculated as the cost of the ingredients in that drink divided by its menu price. Many operators use "pour cost" and "liquor cost" interchangeably, so it's worth clarifying internally which one your team means.
- Markup is the inverse relationship - it tells you how many times over you're charging relative to your cost, rather than what percentage of the sale price the cost represents.
Understanding these distinctions matters because mixing them up can lead to miscalculated pricing or misread reports.
Get Accurate Inventory Valuations
Manage Your Workforce with Altametrics
Data You Need Before You Calculate
Beginning and Ending Inventory Values
You'll need the dollar value of your liquor inventory at both the start and end of your chosen period, valued at cost (what you paid the distributor), not at menu or retail price. This means physically counting every bottle, partial bottle, and case in your storage areas, bar wells, and any backup stock, then valuing that count using your cost records.
Consistency matters here. If you value inventory using average cost one month and most-recent-invoice cost the next, your numbers won't be comparable over time. Pick a valuation method and stick with it.
Purchase Records for the Period
Gather every liquor invoice from your distributors covering the exact period you're measuring - not the date you placed the order, but the date the product was received and added to inventory. Missing an invoice, or including one that falls outside your period, will throw off your entire calculation. Many operators keep a running purchase log or use inventory management software to total this automatically.
Liquor Sales Revenue
Pull liquor sales revenue from your POS system for the same period. This should be liquor sales specifically - separated from food, wine, beer, and non-alcoholic beverage categories if your POS allows that level of detail. The more granular your POS categorization, the more precisely you can calculate liquor cost as distinct from your overall beverage cost.
If your POS lumps all alcohol together, you can still calculate an overall beverage cost percentage, but you'll lose the ability to diagnose whether liquor, wine, or beer specifically is driving any cost issues.
Choosing a Consistent Time Period
Liquor cost can be calculated weekly, monthly, or over any other consistent period - the right choice depends on your operation's size and how closely you want to monitor performance -
- Weekly calculations catch problems faster and are common in higher-volume bars, but require more frequent physical counts.
- Monthly calculations are the most common approach for full-service restaurants, balancing accuracy with the labor involved in taking inventory.
- Periodic (e.g., every 4 weeks) is sometimes used to align with broader accounting cycles.
Whatever period you choose, consistency is what makes the number useful. Comparing a 20% liquor cost from a 7-day period to a 20% liquor cost from a 30-day period can mask meaningful swings caused by weekday/weekend sales mix or a single large event.
How to Take Inventory
There are two common approaches to counting liquor inventory -
1. Count-based (unit) method - You count full bottles as whole units and estimate partial bottles by eye (e.g., "this bottle is about a quarter full"). This is faster but less precise, since eyeballing partial bottles introduces human error.
2. Weight-based method - You weigh each partial bottle using a bar scale calibrated to the bottle's empty weight and the product's density, giving a much more accurate reading of exactly how much liquid remains. This takes more time upfront but produces significantly more reliable numbers, especially for high-cost spirits.
Many operators use a hybrid approach - full bottles are counted as units, while opened bottles are weighed for precision. If you're just starting to formalize your inventory process, weighing opened bottles is one of the highest-value habits to adopt, since partial bottles are where estimation errors accumulate fastest.
Once you know how much product you have, you need to assign it a dollar value -
- Value each item at your actual cost basis - what you paid your distributor - not the price you sell it for.
- If prices fluctuate between purchases, decide on a consistent valuation method (such as most-recent-invoice cost or weighted average cost) and apply it uniformly.
- Compare your counted quantities against your established par levels (the ideal stock quantity for each item). This isn't required for the cost calculation itself, but it helps you spot discrepancies - if your count is significantly below what your sales and purchases would predict, that's an early signal of overpouring, waste, or theft worth investigating.
A few recurring errors can quietly undermine the accuracy of your counts -
1. Inconsistent count timing - Counting inventory at different times of day (e.g., before vs. after a busy Friday night) between periods skews comparisons.
2. Missing storage locations - Forgetting to count backup stock in storerooms, walk-ins, or satellite bars.
3. Mixing valuation methods - Switching between cost-basis approaches from one count to the next.
4. Rushed or single-person counts - Errors multiply when one person counts quickly without a second check; a two-person count (one counting, one recording) reduces mistakes.
5. Not accounting for open/damaged bottles - Broken, corked, or spoiled product should be logged separately so it doesn't get treated as sellable inventory.
Once you have accurate beginning and ending inventory figures, you're ready to plug everything into the formula.
Running the Calculation

Worked Example
Say you're calculating liquor cost for the month of March -
- Beginning Inventory (March 1, at cost). $12,500
- Purchases during March (per invoices). $9,200
- Ending Inventory (March 31, at cost). $11,000
- Liquor Sales for March (per POS). $52,000
Step 1. Calculate Cost of Goods Sold (COGS)
Beginning Inventory + Purchases - Ending Inventory
= $12,500 + $9,200 $11,000
= $10,700
This is the dollar value of liquor actually consumed during March - whether it was sold, comped, spilled, or otherwise used.
Step 2. Divide COGS by Liquor Sales
$10,700 / $52,000 = 0.2058
Step 3. Convert to a Percentage
0.2058 x 100 = 20.6%
That means roughly 20.6 cents of every dollar in liquor sales went toward the cost of the product itself - a figure that falls within the typical 18-24% benchmark range.
Calculating Liquor Only vs. Total Beverage Program
You can run this same formula at different levels of granularity -
1. Liquor only - isolates spirits, giving you the clearest read on your bar's core pouring and purchasing efficiency.
2. Total beverage cost - combines liquor, beer, and wine into a single COGS and sales figure. This is useful for a big-picture view but can mask category-specific problems, since wine typically carries a different cost percentage than liquor, and beer different still.
If your POS and inventory system allow it, calculating each category separately - and then a blended total - gives you the most actionable insight.
Adjusting for Comps, Spillage, and Staff Drinks
The raw formula treats all liquor "used" as if it generated revenue, which isn't quite true. A few adjustments make the number more meaningful -
1. Comped drinks - Liquor given away (manager comps, promotions, industry discounts) is consumed from inventory but generates no sales revenue. If comps are significant, track their cost separately and consider excluding it from your "sold" cost basis, or at least noting it alongside your liquor cost % so you understand how much of your cost is comp-driven versus operational inefficiency.
2. Spillage and breakage - Bottles dropped, over-poured, or spilled during service reduce inventory without generating revenue. Some operators log estimated spillage as its own line item so it doesn't get mistaken for theft or overpouring when reviewing the numbers.
3. Staff drinks - If employees are allowed drinks during or after shifts, this should be tracked (and typically valued at cost) separately from customer sales, similar to comps.
Without separating these out, a restaurant with heavy comping or a generous staff-drink policy might see an elevated liquor cost percentage and wrongly assume it's a pouring or theft problem, when in fact it's a policy cost. Tracking these categories separately, even in a simple spreadsheet, makes your core liquor cost percentage a much more reliable diagnostic tool.
Transform Your Restaurant Operations Now!
Effortless Inventory Tracking with Altametrics!
How to Interpret Your Liquor Cost Percentage
What a "Good" vs. "High" Liquor Cost Signals
As a general guideline, most full-service restaurants and bars fall in the 1824% range for liquor cost -
1. On the lower end (18-20%) - Typically indicates tight pouring discipline, well-negotiated purchasing, and pricing that comfortably covers cost. This is often the target range for high-volume bar programs.
2. In the mid-range (20-22%) - Common for restaurants with a broader liquor selection, including some premium or craft offerings that naturally carry higher costs.
3. On the higher end (22-24%+) - Not automatically a problem, but worth investigating. This could reflect a premium-focused cocktail program (which is a deliberate choice), or it could point to inefficiencies like over-pouring, waste, or pricing that hasn't kept pace with rising liquor costs.
There's no single "correct" number that applies to every restaurant. A steakhouse with an extensive top-shelf whiskey list will naturally run a different liquor cost than a casual bar focused on well drinks and beer. What matters most is tracking your own number consistently over time and understanding what's driving any changes.
Differences by Category
Liquor cost percentage isn't uniform across every type of pour. If you're able to break your calculation down by category, you'll typically see meaningful differences -
1. Well liquor - Usually the lowest cost percentage, since well spirits are typically less expensive and poured in standardized amounts.
2. Premium and top-shelf spirits - Often carry a higher cost percentage relative to their price point, since markup percentages tend to compress at higher price tiers (customers are less tolerant of extreme markups on a $60 bottle pour than a $6 one).
3. Cocktails - Cost percentage varies widely depending on the number and cost of ingredients, garnishes, and specialty mixers. A cocktail with fresh juices, house-made syrups, or multiple spirits will often run a higher cost than a simple two-ingredient drink.
4. Wine and beer - Typically calculated and benchmarked separately from liquor, since their cost structures and typical margins differ meaningfully from spirits.
Blending all of these into a single "beverage cost" number can obscure which category is actually driving your overall performance.
When a Low Percentage Might Be a Red Flag
It's tempting to assume a lower liquor cost percentage is always good news, but an unusually low number - especially one that drops suddenly - can actually signal a problem rather than an improvement -
1. Under-pouring - If bartenders are pouring less than the recipe calls for, customers may notice weaker drinks, which can hurt satisfaction and repeat business even as your cost percentage looks better on paper.
2. Theft masking as savings - In some cases, theft of cash (rather than product) can make liquor cost appear artificially low, since the liquor is still being poured and sold, but the revenue isn't being recorded accurately.
3. Inventory counting errors - An inflated ending inventory count (whether from a rushed count or a mistake) will understate COGS and make your liquor cost look better than it actually is.
Because of this, a liquor cost percentage should never be evaluated purely as "lower is always better." A sudden, unexplained shift in either direction - high or low - is a signal to dig deeper, not just a number to celebrate or panic over.
Common Reasons Liquor Cost Runs High
Over-Pouring and Inconsistent Recipes
This is one of the most frequent - and most fixable - causes of elevated liquor cost. When bartenders free-pour instead of using jiggers or measured pours, even small inconsistencies add up quickly across hundreds of drinks. A bartender who consistently pours a quarter-ounce over the recipe on every drink can meaningfully inflate your cost percentage over a month, without ever intending to shortchange the business.
Inconsistent recipes compound the problem - if different staff members make the same cocktail with different proportions, or substitute a premium spirit when a well option runs out, your actual cost will drift from what your menu pricing assumes.
Theft, Waste, and Spillage
Liquor is a high-value, easily concealed product, which makes it a common target for both employee and, less often, external theft. This can take several forms -
1. Product theft - Bottles removed from inventory without being sold.
2. Cash theft - Drinks poured and served, but payment not properly recorded through the POS (sometimes called a "walked" tab or unrung sale).
3. Comping abuse - Staff giving away drinks to friends or for personal use, disguised as legitimate comps.
Waste and spillage, while usually unintentional, also contribute - broken bottles, over-poured drinks that get remade, or product that spoils before use (less common with spirits than wine, but still possible with cream- or juice-based ingredients).
Pricing Errors or Outdated Menu Pricing
Liquor cost isn't just about what happens behind the bar - it's also about whether your menu pricing reflects current costs. A few common pricing issues -
1. Distributor price increases that haven't been passed through - If your cost per bottle rises but your menu price stays the same, your liquor cost percentage will climb even if pouring behavior hasn't changed at all.
2. Underpriced specialty cocktails - A drink with an elaborate ingredient list may be priced closer to your simpler cocktails without accounting for its higher actual cost.
3. Happy hour and promotional pricing - Discounted pricing periods can distort your overall liquor cost percentage if a large share of sales happens during those windows.
Poor Inventory Controls
Weak inventory processes don't just make it hard to calculate liquor cost accurately - they also make it easier for cost problems to go undetected in the first place. Common gaps include -
- Infrequent counts that let issues accumulate for weeks before being noticed.
- Lack of restricted access to storage areas, making it harder to track who has access to inventory.
- No system for logging comps, spillage, or staff drinks separately, which makes it difficult to distinguish legitimate costs from unexplained shrinkage.
- Inconsistent receiving procedures, where delivered quantities aren't verified against invoices before being added to inventory.
Identifying which of these factors is driving your specific liquor cost increase is the first step toward fixing it.
Steps to Improve and Control Liquor Cost
Standardize Pour Sizes and Recipes
Consistency is the foundation of cost control behind the bar -
- Use jiggers or measured pouring tools rather than relying on free-pouring, even for experienced bartenders. Precision tools remove guesswork and human variability from every drink.
- Document standardized recipes for every cocktail, including exact ingredient quantities, so the drink - and its cost stays consistent regardless of who's making it.
- Train new staff on recipe cards and pour standards during onboarding, and periodically retrain existing staff, since habits can drift over time even among experienced bartenders.
- Consider portion-controlled pour spouts for high-volume well liquors, which physically limit the amount dispensed per pour.
Implement Regular Inventory Audits
Consistent, disciplined counting is what makes your liquor cost percentage trustworthy in the first place -
- Set a fixed schedule for physical counts - weekly or monthly - and stick to it, rather than counting only when something feels off.
- Use a two-person counting process where possible, with one person counting and another recording, to reduce errors.
- Weigh opened bottles rather than estimating by eye, particularly for higher-cost spirits where small estimation errors carry more financial weight.
- Reconcile counts against expected inventory based on sales and purchases, and investigate any significant variance promptly rather than letting it recur across multiple periods.
Use Technology - POS Integration and Inventory Software
Manual tracking is prone to error and hard to sustain as your operation grows. Technology can close many of the gaps that lead to inflated liquor cost -
- POS-integrated inventory systems can automatically calculate theoretical usage based on recipes and sales, then compare it against actual usage from physical counts - surfacing variances that would otherwise go unnoticed.
- Bar management and smart pour systems can track and limit pours in real time, providing detailed pour-level data per bartender, per shift.
- Automated par-level alerts help prevent both over-ordering (which ties up cash) and stockouts (which can lead to costly substitutions).
- Digital invoice tracking reduces the risk of missed or duplicated purchase entries when calculating COGS.
Even for smaller operations without the budget for advanced bar-management software, a well-maintained spreadsheet with consistent inventory, purchase, and sales tracking can go a long way toward catching problems early.
Review and Adjust Menu Pricing Periodically
Cost control isn't only about reducing waste - it's also about making sure your pricing keeps pace with reality -
- Schedule regular menu cost reviews (quarterly is common) to check whether distributor price changes have outpaced your current pricing.
- Recalculate cost percentages for specialty and seasonal cocktails individually, since these are the drinks most likely to have inaccurate or outdated pricing.
- Adjust happy hour and promotional pricing if data shows these periods are dragging down your overall liquor cost percentage more than intended.
- Communicate pricing changes clearly to staff, so they understand the reasoning and can speak to it if customers ask.
Liquor cost percentage is a powerful diagnostic tool, but it only works if you calculate it consistently, gather accurate data, and take the time to understand what the number is telling you. By standardizing pours, auditing inventory regularly, leveraging the right technology, and revisiting your pricing on a set schedule, you can keep liquor cost within a healthy range - protecting one of your restaurant's most profitable categories.
Streamline Your Inventory. Order Smartly.
Start Simplifying Your Orders with Altametrics
Frequently
Asked Questions
What is the difference between liquor cost and pour cost?
How can a restaurant reduce liquor costs?
What causes liquor cost to increase?
How do you calculate liquor cost percentage?
Must-Read Content
How to Reduce Supply Costs in Your Restaurant
Cut restaurant supply costs by understanding spending, auditing expenses, engineering menus, negotiating with suppliers, controlling inventory, reducing waste, and using technology to monitor everything continuously.
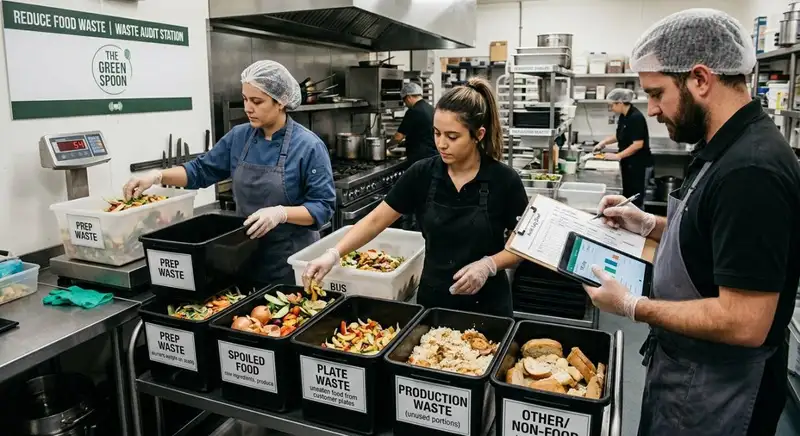
How to Conduct a Food Waste Audit in Your Restaurant
A food waste audit helps restaurant owners identify waste sources, track costs, improve inventory management, reduce food waste, and increase profitability.
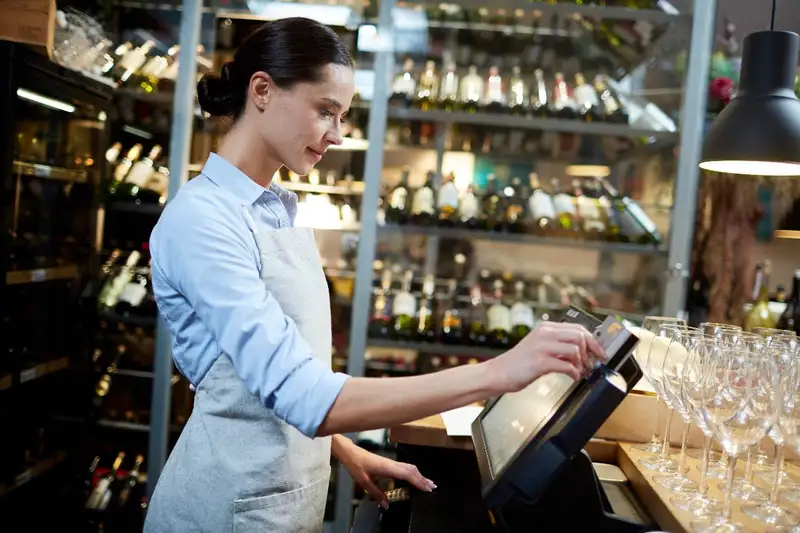
The Complete Guide to Bar Inventory Management for Restaurants
This guide covers bar inventory management essentials - counting, tracking, ordering, storage, variance control, and cost strategies for restaurant profitability.