How can restaurants reduce food waste?
Restaurants can reduce food waste by tracking waste daily, setting accurate par levels, using sales forecasts, improving portion control, rotating inventory correctly, cross-utilizing ingredients, and reviewing slow-moving menu items.
How to Improve Restaurant Profit Margins

Why Profits Shrink
Restaurant profit margins are tight because every sale has to cover many costs before it becomes real profit. Food, labor, rent, utilities, packaging, payment fees, delivery fees, insurance, repairs, marketing, and software all reduce the money left over. A restaurant may have strong sales, but that does not always mean it is keeping enough profit.
Food cost is one of the biggest challenges. When ingredient prices rise, portions are inconsistent, inventory is wasted, or recipes are not costed correctly, margins shrink quickly. A popular menu item can still hurt profit if it uses expensive ingredients or is priced too low.
Labor cost creates another pressure point. Restaurants need enough employees to cook, serve, clean, manage orders, and maintain service quality. But when schedules are not matched to actual demand, labor hours can grow faster than sales. Overtime, turnover, low productivity, and poor shift planning can all reduce profit.
Fixed costs also make margins difficult to manage. Rent, insurance, utilities, leases, and subscriptions still need to be paid during slow weeks.
Raising prices can help, but it can also make customers more cautious. That is why restaurant owners need to find hidden margin leaks in waste, labor, menu performance, vendor costs, discounts, and daily operations.
Understand Your Current Profit Margin
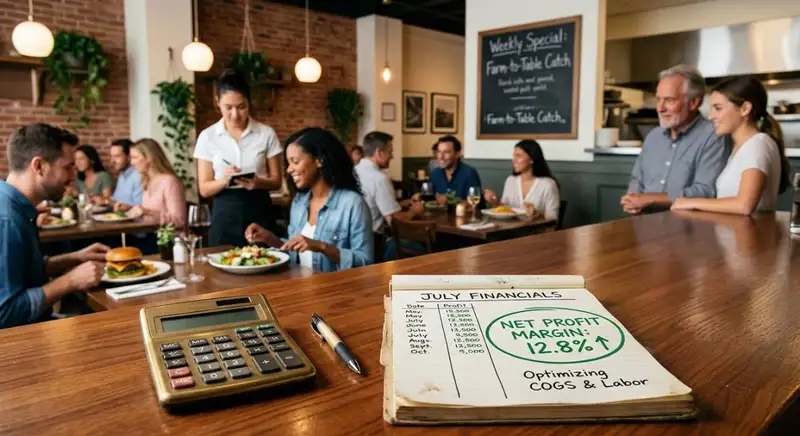
Before restaurant owners can improve profit margins, they need to know where the money is going. Sales alone do not show whether the restaurant is healthy. A busy restaurant can still lose money if food cost, labor cost, rent, fees, and waste are too high. This is why margin improvement should start with the numbers.
The first number to review is gross profit margin. This shows how much money is left after subtracting the cost of food and beverages sold. For example, if a restaurant sells $100,000 in food and beverage and spends $32,000 on ingredients, the gross profit is $68,000. That money still needs to cover labor, rent, utilities, insurance, marketing, and other expenses.
The second number is net profit margin. This shows what is left after all expenses are paid. Net profit margin gives owners a clearer view of how much the restaurant actually keeps from every dollar in sales. If sales are increasing but net profit is flat or shrinking, costs may be rising faster than revenue.
Restaurant owners should also track food cost percentage and labor cost percentage. These two categories usually have the biggest impact on profitability. If food cost rises because of waste, over-portioning, supplier increases, or poor purchasing, margins shrink. If labor cost rises because of overstaffing, overtime, low productivity, or high turnover, profit also drops.
Another important metric is prime cost, which combines food cost and labor cost. Prime cost is useful because it shows how much of each sales dollar is being used by the two largest controllable expenses. When prime cost is too high, the restaurant may struggle to cover fixed costs and still generate profit.
Owners should also review average check size, sales per labor hour, discount usage, delivery fees, and menu item profitability. These numbers help identify whether the problem is low sales, high costs, weak pricing, poor menu mix, or inefficient operations.
Once the current margin is clear, owners can make better decisions. Instead of guessing, they can focus on the areas where small changes will have the biggest financial impact.

Reduce Food Waste
Reducing food waste is one of the fastest ways to improve restaurant profit margins without raising menu prices. Food waste affects profit before the customer even receives the order. It shows up in spoiled inventory, over-prepped ingredients, oversized portions, returned plates, incorrect orders, expired products, and menu items that do not sell fast enough.
This matters because food costs are still a major pressure point for restaurant owners. In 2026, about 82% of restaurant operators reported higher food costs than the previous year, while only 6% reported a decline. At the same time, the USDA estimates that 30% to 40% of the U.S. food supply is wasted. For restaurants, this means every pound of unused food is not just waste. It is lost cash, lost margin, and lost buying power.
Owners can start by tracking waste in numbers, not guesses. If a restaurant does $80,000 in monthly sales and runs a 34% food cost, it spends about $27,200 on food. If better waste control lowers food cost to 32%, monthly food spending drops to $25,600. That is $1,600 in monthly savings or $19,200 per year without increasing prices.
The first area to review is inventory waste. Restaurants should track what gets thrown away, why it was wasted, and how much it cost. Common causes include over-ordering, poor storage, expired ingredients, slow-moving menu items, and inaccurate par levels. A simple weekly waste log can show which products are creating the biggest losses.
The second area is portion control. Even small portion differences can damage margins. If a recipe calls for 6 ounces of protein but employees regularly serve 7 ounces, the restaurant gives away extra product on every plate. That extra ounce may seem small, but across hundreds or thousands of orders, it can turn into a major monthly cost.
The third area is prep planning. Over-prepping is common when managers rely on habit instead of sales patterns. Prep should be based on historical sales, day of week, weather, events, reservations, catering orders, and seasonality. If Tuesday lunch usually sells 40 chicken bowls, prepping for 80 creates unnecessary spoilage risk.
The fourth area is menu design. Ingredients that appear in only one low-selling item are harder to manage because they may expire before being used. A stronger menu uses cross-utilized ingredients across multiple dishes. For example, the same roasted vegetables, sauces, proteins, or garnishes can support several menu items while reducing dead inventory.
Restaurant owners should review these waste metrics every week -
1. Total food waste cost
2. Waste by ingredient
3. Waste by station
4. Spoilage by product
5. Over-prepped items
6. Returned or remade orders
7. Actual food cost vs. target food cost
When restaurants buy more accurately, prep more carefully, portion consistently, and use ingredients across the menu, they can protect margins while still delivering a strong guest experience.
Improve Menu Profitability Item by Item
A restaurant menu is not just a list of food and drink items. It is one of the most important profit tools in the business. Every item on the menu has a different cost, margin, prep time, popularity level, and impact on kitchen operations. If owners only look at total sales, they may miss which items are actually helping or hurting profit.
The first step is to calculate recipe cost for each menu item. This includes every ingredient used in the dish, from the main protein to sauces, garnishes, sides, cooking oil, packaging, and condiments. Once the full cost is known, owners can compare it to the selling price and calculate the item's gross profit.
For example, if a pasta dish sells for $18 and costs $5.40 to make, the food cost percentage is 30% and the gross profit is $12.60. If a steak dish sells for $32 but costs $15 to make, the food cost percentage is about 47% and the gross profit is $17. The steak brings in more dollars per sale, but it also carries a much higher cost risk if portions are inconsistent or supplier prices increase.
Restaurant owners should review each item using two key questions -
1. Is this item popular? Popularity shows how often customers order the item.
2. Is this item profitable? Profitability shows how much money the item contributes after food cost.
This helps owners group menu items into categories. High-profit, high-selling items should be featured more clearly on the menu. Low-profit, high-selling items may need portion adjustments, supplier reviews, or recipe changes. High-profit, low-selling items may need better descriptions, better placement, server recommendations, or promotional support. Low-profit, low-selling items should be reviewed carefully because they may take up inventory, prep time, and menu space without adding enough value.
Menu descriptions also affect profitability. A high-margin item can be overlooked if the description is plain or buried in the wrong section. Strong descriptions should highlight flavor, texture, preparation style, signature ingredients, and value. For example, "chicken sandwich" is less compelling than "crispy buttermilk chicken sandwich with house slaw and spicy honey sauce."
Owners should also look for ingredients that appear in only one or two low-performing items. These ingredients often increase waste because they are harder to use before they expire. A more profitable menu uses ingredients across multiple items, which improves purchasing efficiency and reduces spoilage risk.
Improving menu profitability does not always mean raising prices. In many cases, owners can protect margins by adjusting portions, simplifying recipes, changing menu placement, improving item descriptions, removing slow movers, and promoting items with stronger contribution margins. When every item has a clear financial role, the menu becomes easier to manage and more profitable.
Smarter Labor Scheduling

Labor is one of the largest expenses in a restaurant, which means even small scheduling mistakes can reduce profit margins. If too many employees are scheduled during slow periods, the restaurant pays for labor that does not produce enough sales. If too few employees are scheduled during busy periods, service slows down, mistakes increase, guests wait longer, and sales opportunities may be missed.
Owners should start by tracking labor cost percentage. This shows how much of total sales is spent on wages, payroll taxes, benefits, and related labor expenses. For example, if a restaurant generates $100,000 in weekly sales and spends $32,000 on labor, the labor cost percentage is 32%. If better scheduling lowers labor cost to 30%, the restaurant saves $2,000 per week, or more than $100,000 per year.
Another useful metric is sales per labor hour. This shows how much revenue each scheduled labor hour supports. If the restaurant schedules 900 labor hours for $90,000 in sales, sales per labor hour is $100. If managers schedule too many hours for the same sales volume, productivity drops and margins shrink.
Smarter scheduling starts with sales forecasting. Managers should review historical sales by daypart, day of week, season, weather, local events, reservations, catering orders, online orders, and delivery volume. A Friday dinner shift should not be scheduled the same way as a slow Tuesday afternoon. Labor should follow demand patterns, not habit.
Cross-training also helps control labor costs. When employees can handle more than one role, managers have more flexibility during changing conditions. A cashier who can help with takeout orders, a server who can support hosting, or a cook who can cover multiple stations can reduce idle labor and improve shift coverage.
Overtime is another area to watch closely. A few extra hours may seem manageable, but repeated overtime can quickly increase payroll costs. Owners should review overtime weekly and identify whether it is caused by poor scheduling, understaffing, call-outs, late cuts, or lack of trained backup employees.
Breaks and compliance should also be managed carefully. Labor control should never come from skipping required breaks or ignoring wage rules. A strong scheduling system should help managers plan breaks, avoid unnecessary overtime, and keep the restaurant properly staffed.
Restaurant owners should review these labor metrics every week -
1. Labor cost percentage
2. Sales per labor hour
3. Overtime hours
4. Scheduled hours vs. actual hours
5. Labor by daypart
6. Call-outs and shift changes
7. Manager edits to timecards
8. Labor cost compared to sales forecast
Controlling labor costs does not mean reducing service quality. It means using data to build schedules that match real demand. When staffing levels are planned correctly, restaurants can protect margins, support employees, and give customers a better experience without relying on major price increases.
Streamline Prep, Cut Labor Costs, and Ensure Freshness
Get Digital Prep Sheets with Altametrics!
Increase Average Check
Improving restaurant profit margins does not always require raising every menu price. Another way to increase revenue is to grow the average check. Average check shows how much each guest, table, or order spends. When customers add one more item, upgrade their order, or choose a higher-margin option, the restaurant earns more revenue from the same traffic.
For example, if a restaurant serves 2,000 guests per week with an average check of $24, weekly sales are $48,000. If the average check increases to $26 without adding more guests, weekly sales rise to $52,000. That is an extra $4,000 per week, or more than $200,000 per year before costs. Even after food and labor expenses, this can create meaningful margin improvement.
The key is to increase average check in a way that feels natural to the customer. Guests should not feel pressured. They should see clear value in adding a drink, side, dessert, appetizer, premium topping, combo, or limited-time item.
The first strategy is smart upselling. Servers, cashiers, and online ordering prompts can suggest items that fit the guest's order. For example, a burger order can include a prompt for fries, sauce, a drink, or a premium topping. A pasta order can include a side salad, garlic bread, or dessert suggestion. These small additions can raise check size without changing the base price of the main item.
The second strategy is bundling. Bundles make ordering easier and can increase total spend. A lunch combo, family meal, game-day package, or catering bundle can encourage customers to buy more than they would if each item were listed separately. Bundles work best when they are simple, clear, and built around items with strong contribution margins.
The third strategy is menu placement. High-margin add-ons should be easy to find on printed menus, digital menus, kiosks, and online ordering pages. If sides, beverages, desserts, sauces, and upgrades are hidden, customers may not think to order them. Better placement can improve sales without changing prices.
The fourth strategy is better descriptions. A plain item name may not create interest, but a stronger description can make the item feel more valuable. For example, "chocolate cake" may not stand out, while "warm chocolate cake with vanilla cream and sea salt caramel" creates a stronger reason to order.
The fifth strategy is employee training. Staff should know which items are profitable, which pairings make sense, and how to make recommendations naturally. Instead of saying, "Do you want anything else?" a server might say, "The spicy aioli is our most popular add-on with that sandwich," or "Most tables share the loaded fries before dinner."
Owners should track average check by channel because dine-in, takeout, delivery, catering, and online ordering may perform differently. If online orders have low average checks, the ordering page may need better add-on prompts. If dine-in checks are low, servers may need training. If delivery checks are low, bundles or minimum-order offers may help.
Restaurant owners should review these average check metrics every week -
1. Average check by daypart
2. Average check by sales channel
3. Add-on attachment rate
4. Beverage sales per guest
5. Dessert sales per guest
6. Bundle sales
7. Upsell performance by server
8. Online ordering add-on conversion
When restaurants improve add-ons, bundles, descriptions, and staff recommendations, they can increase revenue per guest while keeping menu prices stable.
Lower Vendor and Operating Costs
Restaurant profit margins can shrink even when sales are steady because many costs rise quietly in the background. Ingredients, packaging, cleaning supplies, utilities, repairs, software, delivery fees, payment processing, and equipment maintenance all affect profitability. If owners do not review these expenses regularly, small increases can become normal before anyone notices the impact.
The first area to review is vendor pricing. Restaurants should compare invoices over time to see which products have increased in cost. A case of chicken, box of produce, cooking oil, paper bags, or takeout containers may rise by a few dollars, but those increases matter when the restaurant buys them every week. Owners should track price changes by item, not just total invoice amount.
The second area is invoice accuracy. Mistakes can happen when products are substituted, quantities are changed, credits are missed, or contract pricing is not applied. If a restaurant receives five supplier invoices per week and each one has only a small error, the annual cost can add up quickly. Managers should compare invoices against purchase orders, delivery receipts, approved pricing, and actual inventory received.
The third area is packaging cost. Takeout and delivery orders often require bags, containers, cups, lids, utensils, napkins, labels, seals, and condiments. If packaging is not tracked, a profitable menu item can become less profitable once the full to-go cost is included. Owners should calculate packaging cost by order type and look for ways to reduce unnecessary extras without hurting the guest experience.
The fourth area is utilities and equipment. Energy, water, gas, refrigeration, ovens, HVAC, lighting, and dishwashing all affect operating costs. Poor equipment maintenance can increase utility bills and create repair emergencies. A cooler that runs inefficiently, a leaking faucet, or an oven that takes too long to heat can raise costs without being obvious during daily service.
The fifth area is subscriptions and service fees. Restaurants often pay for software, music, marketing tools, delivery platforms, payroll systems, accounting support, and maintenance contracts. These tools may be useful, but owners should review whether each expense still supports sales, service, or cost control. Unused or overlapping tools can reduce profit without improving operations.
Restaurant owners should review these cost-control metrics every month -
1. Vendor price changes by item
2. Invoice errors and missed credits
3. Packaging cost per order
4. Delivery and marketplace fees
5. Utility costs as a percentage of sales
6. Repair and maintenance costs
7. Software and subscription expenses
8. Operating cost trends by month
Lowering vendor and operating costs does not mean choosing the cheapest option every time. Poor-quality ingredients, weak packaging, unreliable suppliers, or outdated equipment can hurt service and customer satisfaction. The goal is to make sure every dollar spent has a clear purpose. When owners review invoices, negotiate pricing, reduce wasteful packaging, maintain equipment, and remove unnecessary expenses, they can improve margins without asking customers to pay more.
Track Margin Metrics Every Week
Improving restaurant profit margins is not a one-time project. Costs change, sales patterns shift, employees come and go, suppliers adjust prices, and customer behavior changes by season, daypart, weather, and local demand. If owners only review profit at the end of the month, they may find problems after too much money has already been lost.
Weekly tracking helps restaurant owners catch margin issues early. A small increase in food cost, overtime, waste, discounts, or delivery fees may not look serious in one day. But if the same issue continues for several weeks, it can reduce profit quickly. A weekly review gives owners and managers enough time to adjust purchasing, scheduling, menu items, promotions, and operating habits before the problem grows.
The first metric to review is food cost percentage. If food cost rises from 31% to 34%, the restaurant should identify what changed. The issue may be supplier price increases, over-portioning, spoilage, theft, waste, menu mix, or incorrect recipe costing.
The second metric is labor cost percentage. Labor should be compared to sales, not just total payroll dollars. If sales are down but scheduled hours stay the same, labor cost percentage increases. Owners should compare scheduled hours, actual hours, overtime, call-outs, and sales per labor hour.
The third metric is prime cost, which combines food cost and labor cost. This number gives owners a quick view of whether the restaurant's two biggest controllable expenses are in line with sales. If prime cost is too high, even strong revenue may not turn into healthy profit.
Owners should also review average check, menu item profitability, waste, discounts, refunds, delivery platform fees, and vendor price changes. These numbers show where margin is being lost and where small improvements can create better results.
A simple weekly margin dashboard should include -
1. Total sales
2. Gross profit margin
3. Food cost percentage
4. Labor cost percentage
5. Prime cost
6. Waste cost
7. Average check size
8. Sales per labor hour
9. Overtime hours
10. Discounts and comps
11. Delivery and marketplace fees
12. Top and bottom menu items by margin
The goal is to make margin management part of the restaurant's routine. Owners do not need to wait until profit drops to take action. When managers review the right numbers every week, they can make faster decisions, correct small problems, and protect profitability without relying on major price increases.
Consistent tracking also creates accountability. Managers know which numbers matter, employees understand how daily actions affect cost, and owners gain a clearer view of what is working. Over time, this turns profit margin improvement from guesswork into a repeatable operating system.
Inventory management
How to Conduct a Food Waste Audit in Your Restaurant

Software integration
Smart Ways to Use AI in Your Restaurant

Employee scheduling
Employee Time Tracking Tips for Restaurants

Employee scheduling
7 Scheduling Mistakes Restaurant Owners Should Stop Making

Employee scheduling
Human Resource Management for Restaurants
Employee scheduling
Common Payroll Challenges in Restaurants

Sales forecasting
How to Use Restaurant Analytics to Improve Profitability

Restaurant management
The Complete Guide to Restaurant Reputation Management

Accounting payroll
Restaurant Cash Handling Procedures

Frequently Asked Questions
How can menu changes improve profit margins?
Menu changes improve margins by promoting high-profit items, removing low-performing dishes, adjusting portions, improving descriptions, simplifying recipes, and using ingredients across multiple menu items. A profitable menu should balance customer demand with contribution margin.
What is the average check size?
Average check size is the average amount a guest, table, or order spends. Restaurants can increase average check through add-ons, bundles, beverages, desserts, premium toppings, server recommendations, and online ordering prompts.
How do vendor costs affect restaurant margins?
Vendor costs affect margins because ingredient, packaging, and supply prices can rise quietly over time. Restaurants should review invoices, compare pricing, check for errors, negotiate with vendors, and track cost changes by item.
What is the prime cost in a restaurant?
Prime cost is the total of food cost plus labor cost. It is one of the most important restaurant profitability metrics because food and labor are usually the two largest controllable expenses.