What is restaurant analytics?
Restaurant analytics is the process of collecting and analyzing restaurant data, such as sales, labor, food costs, inventory, and customer transactions, to improve operational and financial decisions.
How to Use Restaurant Analytics to Improve Profitability

How Restaurant Analytics Impacts Profitability
Restaurant analytics helps owners turn operational data into decisions that can directly affect revenue, costs, and profit margins. Instead of relying on assumptions, owners can use data from sales, labor, food costs, inventory, and other areas of the business to identify where money is being earned or lost.
Profitability depends on more than increasing sales. A restaurant can generate higher revenue while seeing little improvement in profit if labor costs, food costs, waste, or other operating expenses increase at the same time. Restaurant analytics provides a broader view of these relationships, helping owners understand how changes in one area affect overall financial performance.
For example, sales analytics can show whether revenue is increasing because of higher transaction volume, larger average checks, or stronger performance from specific menu items. Labor analytics can then show whether the additional sales require more labor hours and whether the increase in revenue justifies the additional labor expense. Similarly, food and inventory analytics can help determine whether higher sales are accompanied by higher ingredient usage, waste, or purchasing costs.
The most useful restaurant analytics typically brings together several categories of data -
1. Sales data - Revenue, transactions, average check size, menu-item sales, and sales by daypart.
2. Labor data - Labor costs, hours worked, overtime, scheduled hours, and sales per labor hour.
3. Food-cost data - Ingredient costs, recipe costs, food cost percentage, and purchasing trends.
4. Inventory data - Inventory levels, usage, turnover, waste, and variance.
5. Menu data - Item popularity, contribution margins, pricing, and product mix.
6. Location data - Performance comparisons across individual restaurants or operating periods.
The goal is not simply to collect more data. The goal is to identify patterns that reveal opportunities to improve margins. When owners regularly compare revenue against labor, food, inventory, and other operating costs, they can identify areas where performance is falling below expectations and determine where corrective action may have the greatest financial impact.
A consistent analytics process also makes profitability easier to manage over time. Owners can establish benchmarks, monitor changes, investigate significant variances, and measure whether operational decisions are producing the desired financial results.
Data Sources and Key Tools

Before you can analyze anything, you need to know where your data lives and make sure it is reliable. Most restaurants already collect more information than they use. The challenge is that it is scattered across different systems.
Where Your Data Comes From
The point-of-sale (POS) system is the center of your data. It records every transaction, including items sold, order times, discounts, voids, payment types, and sales channels. Your scheduling and payroll software holds labor data such as hours worked, wage rates, and overtime. Inventory tools or manual count sheets track what is on hand and what has been used. Supplier invoices show what you pay for ingredients and how those prices change over time. Finally, your accounting platform ties everything together in a profit-and-loss statement.
Consolidating Your Information
Looking at each source separately gives you only part of the picture. Sales data means little without knowing what labor and food cost went into producing it. Many modern POS platforms integrate with scheduling, inventory, and accounting tools, allowing numbers to flow into a single dashboard. If your systems do not connect, a well-organized spreadsheet updated weekly can work well, especially for smaller operations.
Accuracy matters more than sophistication. Train staff to ring items in correctly, record waste consistently, and enter invoices promptly. Poor data entry leads to misleading conclusions, so build good habits from the start.
Setting a Reporting Cadence
Different metrics call for different review schedules -
1. Daily - Sales totals, labor hours, and any notable voids or comps
2. Weekly - Labor percentage, food cost estimates, inventory counts, and waste logs
3. Monthly - Full profit-and-loss review, prime cost, and vendor price comparisons
Choosing the Right Tools
Select tools that match your size and needs. A single-location restaurant may only need its POS reports and a simple spreadsheet. Larger operations benefit from dedicated restaurant analytics platforms that combine multiple data streams and flag unusual trends automatically. Prioritize tools that are easy for your team to use, since a powerful dashboard no one checks will not improve profitability.
With a dependable data foundation in place, you are ready to begin analyzing the numbers, starting with sales.
Analyzing Sales Data
Sales data tells you more than how much money came in. Broken down the right way, it shows when guests come, what they spend, and where you are leaving revenue on the table.
Look at Sales by Time and Day
Start by segmenting sales by daypart (breakfast, lunch, dinner, late night) and by day of the week. Most restaurants find that a small number of shifts generate a disproportionate share of revenue. Identifying these peaks helps you protect service quality when it matters most. Identifying the slow periods is just as valuable, since these are the best candidates for targeted promotions, happy hour offers, or reduced operating hours.
Compare Sales Channels
Dine-in, takeout, delivery, and catering each carry different cost structures. A delivery order through a third-party platform may produce the same sales figure as a dine-in order but a much lower margin after commission fees. Track sales and average spend by channel so you can see which ones contribute real profit and which ones simply add volume.
Track the Core Revenue Metrics
Several key figures reveal how efficiently you are converting traffic into revenue -
1. Average check size - Total sales divided by number of checks. Rising averages often reflect effective upselling and menu design.
2. Covers - The number of guests served, which shows whether growth is coming from more traffic or higher spending.
3. Table turn time - How long a table stays occupied. Shorter turns during busy periods mean more sales opportunities.
4. Revenue per available seat hour (RevPASH) - Sales divided by seats multiplied by hours open. This shows how well you use your space and time.
Find the Levers You Can Pull
Once you see the patterns, you can act on them. If average check is low at dinner, train servers to suggest appetizers, sides, or beverages. If table turns are slow on Friday nights, review the ordering and payment flow for bottlenecks. If Tuesday lunch is consistently weak, test a limited-time offer and compare results against previous weeks.
Also review discounts, comps, and voids. Excessive or inconsistent use can quietly erode revenue and sometimes signals training gaps or control issues. The key is to change one variable at a time and measure the outcome. That discipline turns sales analysis from observation into a reliable method for growth.
Menu Engineering
Not every dish that sells well makes money, and not every profitable dish sells well. Menu engineering is the process of analyzing each item's popularity and profitability together so you can shape the menu to maximize overall margin.
Know Your Plate Costs
The starting point is an accurate plate cost for every item, calculated from a standardized recipe. Include all ingredients, garnishes, sauces, and packaging for takeout. Update these figures whenever supplier prices change, since an outdated cost can make an unprofitable item look healthy. Pair this with the menu price to find each item's contribution margin, which is the dollar amount left after food cost is subtracted.
Sort Items Into Four Categories
Compare each item's sales volume (popularity) against its contribution margin (profitability). This places every dish into one of four groups -
1. Stars - High popularity, high margin. These are your strongest items and deserve prominent placement.
2. Plowhorses - High popularity, low margin. Guests love them, but they earn less than they should.
3. Puzzles - Low popularity, high margin. They are profitable but underselling.
4. Dogs - Low popularity, low margin. These are candidates for removal or redesign.
Each group calls for a different response. Protect stars by maintaining quality and consistency. For plowhorses, consider modest price increases, slightly smaller portions, or lower-cost ingredient swaps, and pair them with high-margin sides to lift the overall check. Puzzles may improve with better descriptions, a more visible menu position, or server recommendations. Dogs can often be cut, which simplifies kitchen operations and reduces inventory, or reworked into something more appealing.
Where an item appears affects how often it sells. Guests tend to notice the top corners of a menu section and items set apart in boxes or with clear descriptions. Use these spots for your highest-margin dishes. Avoid cluttering the menu with too many options, which slows decisions and complicates prep.
Menu performance shifts with seasons, ingredient costs, and guest preferences. Revisit your analysis at least quarterly, and after any major price change, so your menu continues to work in your favor.
Controlling Food Costs
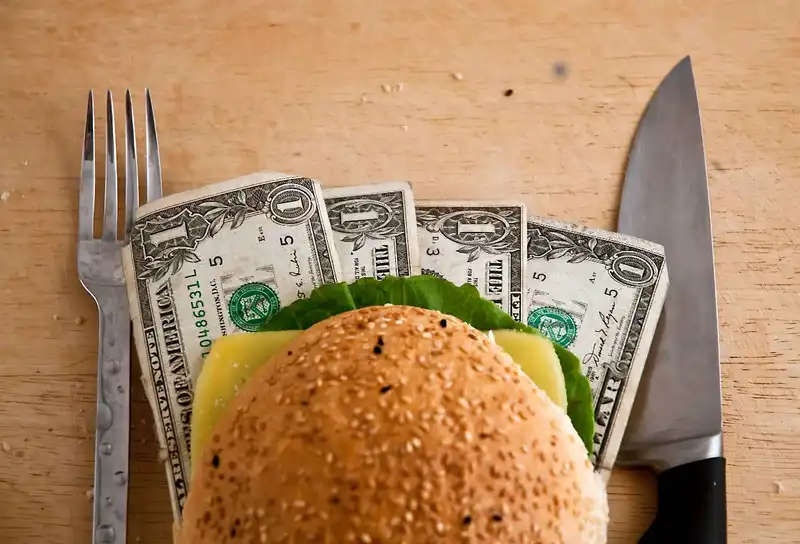
Food cost is one of the largest expenses in any restaurant, and one of the easiest to lose control of. Analytics helps you see not only how much you are spending, but how much you should be spending.
Understand the Core Measures
Cost of goods sold (COGS) is the value of the food and beverage you used during a period. To calculate it, add your beginning inventory to purchases, then subtract ending inventory. Dividing COGS by sales gives your food cost percentage. Many full-service restaurants aim for roughly 28 to 35 percent, though the right target depends on your concept and menu.
Compare Theoretical and Actual Food Cost
Theoretical food cost is what your food cost should be based on your recipes and what you sold. If your POS shows 200 orders of a dish with a plate cost of $4, you should have used $800 worth of ingredients for it. Actual food cost is what you really used, based on inventory and purchases.
The difference between the two is your variance. A small gap is normal, but a consistent or growing one signals a problem worth investigating. Reviewing this weekly, by category such as proteins, produce, dairy, and beverages, helps you pinpoint where the gap is largest.
Identify the Causes of Variance
When actual cost exceeds theoretical cost, the usual culprits include -
1. Over-portioning - Portions that drift larger than the recipe specifies
2. Waste and spoilage - Trim loss, overproduction, and food discarded before use
3. Unrecorded comps or errors - Remakes and giveaways not entered in the POS
4. Receiving issues - Short deliveries or incorrect weights accepted without checking
5. Theft - Less common but possible without proper controls
Portion scales, standardized recipes, prep sheets, and careful receiving practices address most of these issues.
Ingredient prices rarely stay still. Track the cost of your top purchased items over time and compare invoices against agreed prices. If a key item rises sharply, you can request quotes from other vendors, adjust the menu, or substitute an alternative. Consolidating purchases with fewer suppliers may also improve your negotiating position.
Optimizing Labor Costs
Labor is typically the largest controllable expense in a restaurant, often rivaling or exceeding food cost. The goal of labor analytics is not to cut hours indiscriminately, but to place the right number of people on the right shifts.
Track the Key Labor Metrics
Start with labor cost percentage, which is total labor cost divided by sales. Many full-service restaurants target roughly 25 to 35 percent, depending on concept and service style. Pair it with sales per labor hour, which shows how much revenue each paid hour produces. A shift with strong sales and low labor hours is efficient; one with the opposite pattern needs attention.
Then look at prime cost, which combines food cost and labor cost. Because these two categories make up the bulk of your expenses, prime cost is one of the clearest indicators of overall health. Many operators aim to keep it at or below 60 to 65 percent of sales.
Match Scheduling to Demand
Use your sales data by daypart and day of the week to build schedules around expected traffic rather than habit. If Tuesday lunch consistently brings in a fraction of Friday dinner sales, staffing levels should reflect that. Review each shift after the fact by comparing actual sales to labor hours. This reveals shifts that are regularly overstaffed or those where understaffing may be limiting sales and hurting service.
Reduce Overtime and Idle Time
Overtime premiums inflate costs quickly. Monitor hours throughout the week, not just at payroll time, so you can adjust before employees cross overtime thresholds. Staggered start times and shift cuts during slow periods can also reduce idle hours. Cross-training employees to handle multiple roles adds flexibility when demand shifts.
Protect Service and Retention
Cutting too deeply carries its own costs. Understaffed shifts lead to slow service, lower check averages, and burned-out employees. Turnover is expensive, since recruiting and training new staff takes time and money. Track turnover alongside labor percentage, and look for patterns that suggest scheduling or workload problems. Consistent schedules and fair hours often improve both morale and efficiency.
Measure output where possible, such as covers per server or tickets per hour in the kitchen. These figures help you spot training needs and workflow bottlenecks that raise labor cost without adding value.
Inventory Management and Waste Reduction
Inventory is cash sitting on your shelves. Too much of it ties up money and increases spoilage, while too little leads to stockouts, 86'd menu items, and frustrated guests. Analytics helps you find the balance.
Count Consistently
Reliable analysis begins with regular, accurate counts. Many restaurants count high-value items such as proteins and alcohol weekly, and everything else at least monthly. Count at the same time each period, use the same storage-area layout on your count sheet, and have someone other than the person who receives deliveries do the counting when possible. Consistency makes your usage figures trustworthy.
Measure Inventory Turnover
Inventory turnover shows how quickly you use and replace stock. Divide COGS by average inventory value to see how many times you turn your inventory over in a period. A low turnover rate suggests overstocking, which raises the risk of spoilage and freezes cash that could be used elsewhere. Highly perishable categories like produce and seafood should turn over much faster than dry goods.
Set and Adjust Par Levels
Par levels are the target quantities you want on hand for each item. Base them on actual usage data rather than guesswork, accounting for delivery schedules and demand patterns such as busy weekends or seasonal peaks. Review pars regularly, because usage changes as menus and traffic shift. Ordering to par, rather than by habit, reduces over-ordering and emergency purchases at higher prices.
Apply Good Storage Practices
First-in, first-out (FIFO) rotation ensures older products are used before newer ones. Label and date everything, and organize shelves so that rotation is easy to follow. Proper storage temperatures and packaging also extend shelf life and protect quality.
Track and Categorize Waste
Waste is often invisible until you start recording it. Use a simple waste log that captures the item, quantity, estimated cost, and reason. Common categories include -
1. Prep waste - Trim loss and overproduction
2. Spoilage - Items that expired or were stored incorrectly
3. Cooking errors - Dishes burned or made incorrectly
4. Customer returns - Items sent back or uneaten due to quality issues
Review the log weekly to spot patterns. If one item is repeatedly spoiling, you may be ordering too much or the dish may not sell as expected. Recurring prep waste may point to a need for better training or a different purchasing format.
Building a Review Routine
Collecting and analyzing data only pays off when it changes what you do. The final step is bringing your metrics together into a clear view of performance and a routine that turns insights into results.
Build a Unified Profit View
Start with your profit-and-loss statement and highlight prime cost, the combined total of food and labor. Add occupancy, utilities, marketing, and other operating expenses to see where the rest of your money goes. Reviewing these categories side by side shows how a change in one area affects the others. For example, a menu price increase may lift margins but reduce traffic, which then affects labor efficiency.
Set Meaningful Benchmarks
Benchmarks give your numbers context. Establish targets for key metrics such as food cost percentage, labor percentage, prime cost, average check, and waste. Base them on a mix of industry ranges, your concept, and your own historical performance. Be realistic- a fine-dining restaurant and a quick-service cafe will have very different targets. Revisit benchmarks as your business, costs, and menu evolve.
Prioritize the Highest-Impact Opportunities
You will likely find more issues than you can fix at once. Rank opportunities by potential financial impact and ease of implementation. A modest reduction in over-portioning on a high-volume protein, for instance, may be worth more than overhauling a rarely ordered dish. Focus on two or three priorities at a time so changes get proper attention.
Assign Ownership and Accountability
Every metric should have an owner. The kitchen manager might oversee food cost and waste, the front-of-house manager might own scheduling and labor, and you might track overall prime cost. Share relevant numbers with your team in simple terms, and explain how their daily habits influence results. People are more likely to engage when they understand the goal.
Run a Regular Review Routine
Schedule consistent check-ins- a short daily huddle on sales and labor, a weekly meeting on food cost variance, waste, and inventory, and a monthly review of the full P&L and progress toward goals. Keep each meeting focused on decisions and next steps, not just reporting.
Follow a Continuous Improvement Cycle
Use a simple loop - measure your current performance, analyze the causes behind the gaps, adjust one variable at a time, and re-measure to confirm the effect. Repeating this cycle steadily builds stronger margins over time.
Profitability is rarely the result of one big change. It comes from many small, well-informed decisions made consistently, and analytics gives you the visibility to make them with confidence.

Sales forecasting
How to Use Restaurant Analytics to Improve Profitability

Restaurant management
The Complete Guide to Restaurant Reputation Management

Accounting payroll
Restaurant Cash Handling Procedures

Accounting payroll
How to Manage Restaurant Finances

Employee scheduling
How to Motivate Restaurant Staff

Software integration
10 Ways Technology Can Help Control Food Cost in Restaurants

Restaurant management
How Much Should a Restaurant Spend on Marketing?

Inventory management
The Complete Guide to Bar Inventory Management for Restaurants
Frequently Asked Questions
How can restaurant analytics improve profitability?
Restaurant analytics helps owners identify revenue opportunities, control labor and food costs, reduce waste, improve inventory management, and identify operational areas that are reducing profit margins.
What restaurant analytics metrics should owners track?
Important metrics include food cost percentage, labor cost percentage, prime cost, average check size, sales per labor hour, inventory turnover, gross profit margin, and menu item contribution margin.
What is the best way to use restaurant analytics?
The most effective approach is to connect analytics to specific business goals, monitor relevant KPIs, identify performance gaps, take targeted action, and continue measuring results to determine whether profitability is improving.
What data sources are used in restaurant analytics?
Common sources include POS systems, timekeeping and scheduling systems, inventory systems, accounting software, purchasing records, online ordering platforms, and customer data.