

Overview
Restaurant ingredient costs rarely stay the same. Prices for meat, seafood, dairy, produce, and other essential ingredients can fluctuate because of inflation, seasonal availability, supplier changes, and market conditions. Even small increases in purchasing costs can affect how much a restaurant spends preparing its most popular dishes.
For restaurant owners, calculating recipe costs once is not enough. A recipe that generates a healthy profit margin today may become less profitable several months later if ingredient prices increase and menu prices remain unchanged. Without regular cost updates, restaurants risk making financial decisions based on outdated information.
Tracking recipe costs over time helps restaurant owners understand how ingredient price changes affect the cost of preparing each menu item. By maintaining historical ingredient prices and regularly recalculating recipe expenses, operators can identify rising costs before they significantly affect profitability.
For example, consider a restaurant that sells a chicken sandwich for $14. When the recipe is first calculated, its ingredient cost is $4.20, representing a food cost percentage of 30%. If supplier price increases push the recipe cost to $5.04, the food cost percentage rises to 36% without any change in the menu price. Across hundreds of orders, that additional expense can significantly reduce the restaurant's overall profit.
Regular recipe cost tracking gives restaurant owners better visibility into these changes and helps them determine when purchasing adjustments, portion controls, or menu price updates are necessary.
Monitoring recipe costs over time helps restaurants
1. Identify rising ingredient expenses - Recognize supplier price increases and changing purchasing costs before they significantly affect food expenses.
2. Maintain accurate food cost percentages - Ensure recipe calculations reflect current ingredient prices rather than outdated purchasing information.
3. Protect menu profitability - Identify dishes experiencing declining margins and determine whether pricing adjustments are necessary.
4. Improve purchasing decisions - Use historical ingredient costs to compare suppliers, evaluate purchasing alternatives, and plan future orders.
5. Control unnecessary expenses - Distinguish ingredient price increases from food waste, over-portioning, and inconsistent preparation.
By regularly reviewing ingredient prices and updating recipe calculations, restaurant owners can make informed operational decisions, maintain better cost control, and protect their profit margins as purchasing expenses change.
For restaurant owners, calculating recipe costs once is not enough. A recipe that generates a healthy profit margin today may become less profitable several months later if ingredient prices increase and menu prices remain unchanged. Without regular cost updates, restaurants risk making financial decisions based on outdated information.
Tracking recipe costs over time helps restaurant owners understand how ingredient price changes affect the cost of preparing each menu item. By maintaining historical ingredient prices and regularly recalculating recipe expenses, operators can identify rising costs before they significantly affect profitability.
For example, consider a restaurant that sells a chicken sandwich for $14. When the recipe is first calculated, its ingredient cost is $4.20, representing a food cost percentage of 30%. If supplier price increases push the recipe cost to $5.04, the food cost percentage rises to 36% without any change in the menu price. Across hundreds of orders, that additional expense can significantly reduce the restaurant's overall profit.
Regular recipe cost tracking gives restaurant owners better visibility into these changes and helps them determine when purchasing adjustments, portion controls, or menu price updates are necessary.
Monitoring recipe costs over time helps restaurants
1. Identify rising ingredient expenses - Recognize supplier price increases and changing purchasing costs before they significantly affect food expenses.
2. Maintain accurate food cost percentages - Ensure recipe calculations reflect current ingredient prices rather than outdated purchasing information.
3. Protect menu profitability - Identify dishes experiencing declining margins and determine whether pricing adjustments are necessary.
4. Improve purchasing decisions - Use historical ingredient costs to compare suppliers, evaluate purchasing alternatives, and plan future orders.
5. Control unnecessary expenses - Distinguish ingredient price increases from food waste, over-portioning, and inconsistent preparation.
By regularly reviewing ingredient prices and updating recipe calculations, restaurant owners can make informed operational decisions, maintain better cost control, and protect their profit margins as purchasing expenses change.
Build an Accurate Recipe Costing Foundation
Tracking cost changes only works if the starting point is right. If your original plate costs are guesses or rough estimates, every update built on them will carry the same errors forward. Before you monitor anything, you need a baseline you can trust.
Start with standardized recipes
A costable recipe is one that is written down and followed the same way every time. List every ingredient, including the small ones that are easy to overlook, such as cooking oil, garnishes, seasonings, sauces, and the side that comes with the plate. Specify exact quantities in consistent units, preferably by weight rather than volume, since weight is far more precise. Two cooks scooping a cup of shredded cheese can easily end up with different amounts, and that difference is real money over thousands of plates.
A standardized recipe also fixes the portion size. If the recipe says a portion of salmon is six ounces, the kitchen needs to portion it at six ounces. Costing a dish at one portion and serving another is one of the most common ways theoretical and actual costs drift apart.
Account for yield
Most ingredients are not used at the price you pay for them. The price on the invoice is for the product as purchased, but what ends up on the plate is the usable portion after trimming, peeling, boning, or cooking. A whole beef tenderloin, a case of romaine, and a bag of onions all lose weight before they are served.
To capture this, calculate the yield percentage -
Yield % = Usable weight / As-purchased weight x 100
Then find the true cost of the usable product -
Usable cost per unit = Purchase cost per unit Yield %
For example, if you buy a product at 10 dollars per pound and it has an 80 percent yield after trimming, the usable cost is 12.50 dollars per pound. Ignoring yield understates your plate cost, and the gap grows larger with high-waste items like whole fish, bone-in cuts, and fresh produce. It's worth testing yields yourself rather than relying on generic charts, since your cuts, your trimming standards, and your suppliers' products will all affect the result. Retest periodically, because a change in supplier or product grade can change yield even when the price does not.
Standardize units and conversions
Ingredients are bought in one unit and used in another. You may purchase flour by the 50-pound bag, olive oil by the gallon, and herbs by the bunch, but your recipes call for ounces, milliliters, and teaspoons. Build a consistent conversion table so every ingredient's purchase cost can be translated into a cost per recipe unit. This is where many spreadsheet errors begin, so double-check conversions for each ingredient, especially for items sold by count or bunch where weight can vary.
With standardized quantities, yields, and conversions in place, you can calculate the cost of each menu item -
1. Determine the usable cost per unit for each ingredient.
2. Multiply by the quantity used in the recipe.
3. Add up all ingredient costs to get the total recipe cost.
4. Divide by the number of portions to get the cost per plate.
Once you have plate cost, calculate the food cost percentage -
Food cost % = Plate cost / Menu price x 100
If a dish costs 4.20 dollars to make and sells for 14.00 dollars, its food cost percentage is 30 percent. Compare this against the target you have set for that category. Targets vary by concept and menu, so choose ones that fit your business rather than borrowing a number from elsewhere. Many operators set different targets for different categories, accepting a higher percentage on proteins and a lower one on pasta, salads, or beverages.
A complete costing includes more than the main ingredients. Add a small allowance for items that are used but hard to measure, such as frying oil, salt, pepper, garnishes, and condiments. Consider including packaging for takeout and delivery items, since these costs can be significant and often go unaccounted for. A recipe cost that leaves these out will look better on paper than it performs in reality.
Finally, treat each costing as a snapshot in time. Note the date it was calculated and the supplier prices used. This step is easy to skip, but it is what makes tracking over time possible. Without a dated baseline, you have nothing to compare future costs against, and you cannot tell when or why a dish began to slip.
Start with standardized recipes
A costable recipe is one that is written down and followed the same way every time. List every ingredient, including the small ones that are easy to overlook, such as cooking oil, garnishes, seasonings, sauces, and the side that comes with the plate. Specify exact quantities in consistent units, preferably by weight rather than volume, since weight is far more precise. Two cooks scooping a cup of shredded cheese can easily end up with different amounts, and that difference is real money over thousands of plates.
A standardized recipe also fixes the portion size. If the recipe says a portion of salmon is six ounces, the kitchen needs to portion it at six ounces. Costing a dish at one portion and serving another is one of the most common ways theoretical and actual costs drift apart.
Account for yield
Most ingredients are not used at the price you pay for them. The price on the invoice is for the product as purchased, but what ends up on the plate is the usable portion after trimming, peeling, boning, or cooking. A whole beef tenderloin, a case of romaine, and a bag of onions all lose weight before they are served.
To capture this, calculate the yield percentage -
Yield % = Usable weight / As-purchased weight x 100
Then find the true cost of the usable product -
Usable cost per unit = Purchase cost per unit Yield %
For example, if you buy a product at 10 dollars per pound and it has an 80 percent yield after trimming, the usable cost is 12.50 dollars per pound. Ignoring yield understates your plate cost, and the gap grows larger with high-waste items like whole fish, bone-in cuts, and fresh produce. It's worth testing yields yourself rather than relying on generic charts, since your cuts, your trimming standards, and your suppliers' products will all affect the result. Retest periodically, because a change in supplier or product grade can change yield even when the price does not.
Standardize units and conversions
Ingredients are bought in one unit and used in another. You may purchase flour by the 50-pound bag, olive oil by the gallon, and herbs by the bunch, but your recipes call for ounces, milliliters, and teaspoons. Build a consistent conversion table so every ingredient's purchase cost can be translated into a cost per recipe unit. This is where many spreadsheet errors begin, so double-check conversions for each ingredient, especially for items sold by count or bunch where weight can vary.
With standardized quantities, yields, and conversions in place, you can calculate the cost of each menu item -
1. Determine the usable cost per unit for each ingredient.
2. Multiply by the quantity used in the recipe.
3. Add up all ingredient costs to get the total recipe cost.
4. Divide by the number of portions to get the cost per plate.
Once you have plate cost, calculate the food cost percentage -
Food cost % = Plate cost / Menu price x 100
If a dish costs 4.20 dollars to make and sells for 14.00 dollars, its food cost percentage is 30 percent. Compare this against the target you have set for that category. Targets vary by concept and menu, so choose ones that fit your business rather than borrowing a number from elsewhere. Many operators set different targets for different categories, accepting a higher percentage on proteins and a lower one on pasta, salads, or beverages.
A complete costing includes more than the main ingredients. Add a small allowance for items that are used but hard to measure, such as frying oil, salt, pepper, garnishes, and condiments. Consider including packaging for takeout and delivery items, since these costs can be significant and often go unaccounted for. A recipe cost that leaves these out will look better on paper than it performs in reality.
Finally, treat each costing as a snapshot in time. Note the date it was calculated and the supplier prices used. This step is easy to skip, but it is what makes tracking over time possible. Without a dated baseline, you have nothing to compare future costs against, and you cannot tell when or why a dish began to slip.
Streamline Operations
Control Menus, Items, and Prices Seamlessly with Altametrics
Set Up a System to Capture Ingredient Price Changes
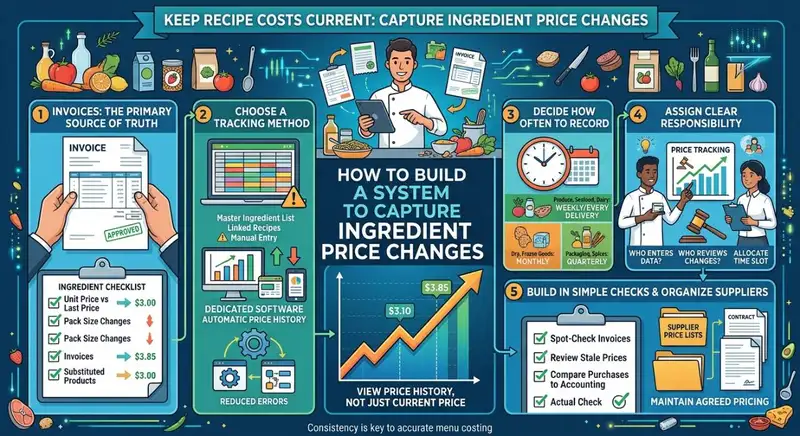
A recipe cost is only as current as the prices behind it. Once your baseline is established, the next step is building a routine that captures price changes as they happen, rather than discovering them weeks later in a financial statement. The goal is simple - every time a price changes, you know about it, and it gets recorded in one place.
Supplier invoices are the most reliable record of what you actually paid. Price lists, sales rep quotes, and online catalogs show what a product is supposed to cost, but invoices show what it did cost, including fuel surcharges, minimum order fees, and substitutions. Build the habit of reviewing every invoice at the time of delivery or shortly after, and record the unit price for each item.
When reviewing, look beyond the total. Check the following -
- Unit price versus the last recorded price for each ingredient
- Pack size or weight changes, such as a case that now contains fewer pounds than before
- Substituted products, where a different brand or grade was delivered in place of what you ordered
- Added charges, including delivery fees, fuel surcharges, and small-order fees
- Quantity discrepancies between what was invoiced and what was received
Catching these at delivery gives you the chance to correct errors and dispute charges while the details are fresh.
Choose a tracking method that fits your operation
How you store price data matters less than whether you do it consistently. The main options include -
1. Spreadsheets. A well-organized spreadsheet works for smaller operations or simpler menus. Create a master ingredient list with columns for supplier, purchase unit, price, date of last update, and cost per recipe unit. Link your recipe costing sheets to this list so that updating an ingredient price automatically updates every recipe that uses it. The weakness of spreadsheets is manual data entry, which is time-consuming and prone to typos and skipped updates.
2. Inventory and recipe costing software. Dedicated restaurant platforms can import invoice data, keep a running history of ingredient prices, recalculate plate costs automatically, and flag changes above a set threshold. Some can read invoices through scanning or integrate with supplier ordering systems, which reduces manual entry significantly. These tools tend to pay off as the menu grows, the number of suppliers increases, or the owner has less time to maintain spreadsheets.
3. Accounting and purchasing integrations. If you already use accounting or purchasing software, check whether it can feed invoice data into your costing process. Reducing the number of times a price is typed by hand reduces errors.
Whichever you choose, the system should store price history, not just the current price. Being able to see that an ingredient moved from 3.10 to 3.85 over four months is far more useful than knowing only that it costs 3.85 today.
Decide how often to record prices
Not every ingredient needs the same attention. A practical approach is to match frequency to volatility -
- Weekly or at every delivery for fast-moving items such as produce, seafood, fresh proteins, and dairy
- Monthly for moderately stable goods like dry grocery items, canned products, and frozen goods
- Quarterly or when notified for very stable items such as packaging, spices, and some beverages
If a supplier raises prices, update the record immediately rather than waiting for the next scheduled review.
Price tracking fails most often because no one owns it. Decide who is responsible for entering invoice data, who reviews changes, and who approves menu or purchasing decisions based on the results. In a smaller restaurant, this might be the owner or general manager. In a larger operation, it may be a chef, a kitchen manager, or a dedicated purchasing or back-office role. Whoever it is, give them a regular time slot, such as a set hour after the main delivery day, so the task becomes routine rather than something done when there is time.
Maintain a current price list for each major supplier and note when it was last confirmed. Where possible, ask suppliers to notify you of price changes in writing, and keep track of any agreed pricing or contract terms. Having this on file makes it easier to spot when an invoice price does not match what was agreed.
A few light controls help keep the data trustworthy. Spot-check a handful of invoice prices against your records each week. Review the ingredient list for items that haven't been updated in an unusually long time, since a stale price is often a sign something was missed. And periodically compare your recorded purchases to your accounting records to confirm nothing is falling through the cracks.
Supplier invoices are the most reliable record of what you actually paid. Price lists, sales rep quotes, and online catalogs show what a product is supposed to cost, but invoices show what it did cost, including fuel surcharges, minimum order fees, and substitutions. Build the habit of reviewing every invoice at the time of delivery or shortly after, and record the unit price for each item.
When reviewing, look beyond the total. Check the following -
- Unit price versus the last recorded price for each ingredient
- Pack size or weight changes, such as a case that now contains fewer pounds than before
- Substituted products, where a different brand or grade was delivered in place of what you ordered
- Added charges, including delivery fees, fuel surcharges, and small-order fees
- Quantity discrepancies between what was invoiced and what was received
Catching these at delivery gives you the chance to correct errors and dispute charges while the details are fresh.
Choose a tracking method that fits your operation
How you store price data matters less than whether you do it consistently. The main options include -
1. Spreadsheets. A well-organized spreadsheet works for smaller operations or simpler menus. Create a master ingredient list with columns for supplier, purchase unit, price, date of last update, and cost per recipe unit. Link your recipe costing sheets to this list so that updating an ingredient price automatically updates every recipe that uses it. The weakness of spreadsheets is manual data entry, which is time-consuming and prone to typos and skipped updates.
2. Inventory and recipe costing software. Dedicated restaurant platforms can import invoice data, keep a running history of ingredient prices, recalculate plate costs automatically, and flag changes above a set threshold. Some can read invoices through scanning or integrate with supplier ordering systems, which reduces manual entry significantly. These tools tend to pay off as the menu grows, the number of suppliers increases, or the owner has less time to maintain spreadsheets.
3. Accounting and purchasing integrations. If you already use accounting or purchasing software, check whether it can feed invoice data into your costing process. Reducing the number of times a price is typed by hand reduces errors.
Whichever you choose, the system should store price history, not just the current price. Being able to see that an ingredient moved from 3.10 to 3.85 over four months is far more useful than knowing only that it costs 3.85 today.
Decide how often to record prices
Not every ingredient needs the same attention. A practical approach is to match frequency to volatility -
- Weekly or at every delivery for fast-moving items such as produce, seafood, fresh proteins, and dairy
- Monthly for moderately stable goods like dry grocery items, canned products, and frozen goods
- Quarterly or when notified for very stable items such as packaging, spices, and some beverages
If a supplier raises prices, update the record immediately rather than waiting for the next scheduled review.
Price tracking fails most often because no one owns it. Decide who is responsible for entering invoice data, who reviews changes, and who approves menu or purchasing decisions based on the results. In a smaller restaurant, this might be the owner or general manager. In a larger operation, it may be a chef, a kitchen manager, or a dedicated purchasing or back-office role. Whoever it is, give them a regular time slot, such as a set hour after the main delivery day, so the task becomes routine rather than something done when there is time.
Maintain a current price list for each major supplier and note when it was last confirmed. Where possible, ask suppliers to notify you of price changes in writing, and keep track of any agreed pricing or contract terms. Having this on file makes it easier to spot when an invoice price does not match what was agreed.
A few light controls help keep the data trustworthy. Spot-check a handful of invoice prices against your records each week. Review the ingredient list for items that haven't been updated in an unusually long time, since a stale price is often a sign something was missed. And periodically compare your recorded purchases to your accounting records to confirm nothing is falling through the cracks.
Monitor Volatile and High-Impact Ingredients First
Tracking every ingredient with equal intensity is neither realistic nor necessary. A typical restaurant buys hundreds of items, but a small share of them drives most of the spending and most of the price surprises. Focusing your attention where it matters most lets you catch the changes that threaten margins without drowning in data.
Think about each ingredient along two dimensions -
1. Impact. How much of your total food spending does this ingredient represent? A modest price increase on a product you buy in large volumes will cost far more than a large increase on something you use sparingly. Ten percent more on saffron barely registers. Ten percent more on chicken, if chicken appears across a dozen dishes, can change your monthly results.
2. Volatility. How often and how sharply does the price move? Some products are stable for months, while others can swing from week to week because of seasonality, weather, supply disruptions, or commodity market shifts.
The ingredients that rank high on both measures deserve the closest watch. High-impact but stable items need regular, less frequent checks. Volatile but low-impact items can usually be monitored loosely.
Use ABC analysis to rank your ingredients
ABC analysis is a simple way to sort ingredients by how much they contribute to total spending. Here is how to do it -
1. Pull purchase data for a representative period, such as the last three months.
2. Calculate total spend for each ingredient (quantity purchased multiplied by price paid).
3. Rank ingredients from highest spend to lowest.
4. Calculate each item's share of total spending and add up the running percentage.
5. Divide the list into categories.
In general terms -
- A items are the small number of ingredients that account for roughly 70 to 80 percent of spending. These get the tightest monitoring.
- B items make up the next tier, around 15 to 20 percent of spending, and get moderate attention.
- C items are the long tail of ingredients that together account for only a small share of spending. These can be reviewed less often.
The exact percentages will vary by restaurant, but the pattern is usually the same - a short list of ingredients does most of the financial work.
Build a watch list
Turn your analysis into a practical tool by creating a watch list of your top 15 to 25 ingredients, sometimes called a "top 20" list. For each item, record -
- Current price and the price from one month and three months ago
- Percentage change over those periods
- Which menu items use it, and how heavily
- The supplier and any alternative sources
- Any known seasonal pattern
Review this list every week, ideally right after your main delivery day. Because it is short, the review takes minutes rather than hours, and it gives you an early read on the changes most likely to affect profitability.
Know which categories tend to be volatile
While every market is different, certain categories commonly deserve extra scrutiny -
1. Proteins, including beef, poultry, pork, and seafood, which can shift with feed costs, supply cycles, and demand
2. Dairy and eggs, which are subject to supply and seasonal changes
3. Cooking oils and fats, which follow commodity markets
4. Fresh produce, particularly items with short growing seasons or weather exposure
5. Imported goods, which can be affected by currency movements, tariffs, and shipping conditions
Alongside these, keep an eye on items that appear in many recipes, such as onions, flour, butter, or a house sauce base. A product that touches half your menu has an outsized effect even if its unit price seems low.
Once you know which ingredients are on your watch list, map each one to the dishes that use it. This allows you to answer an important question quickly when a price moves - which menu items just became less profitable, and by how much? If a cut of beef rises 12 percent, you should be able to see right away that three entrees and a sandwich are affected, and estimate the weekly impact based on how many of each you sell.
Your priority list is not permanent. Menu changes, new suppliers, seasonal specials, and shifts in what guests order will all change which ingredients matter most. Re-run your ABC analysis every quarter, or whenever you make major changes to the menu, so your attention stays pointed at the right items.
Think about each ingredient along two dimensions -
1. Impact. How much of your total food spending does this ingredient represent? A modest price increase on a product you buy in large volumes will cost far more than a large increase on something you use sparingly. Ten percent more on saffron barely registers. Ten percent more on chicken, if chicken appears across a dozen dishes, can change your monthly results.
2. Volatility. How often and how sharply does the price move? Some products are stable for months, while others can swing from week to week because of seasonality, weather, supply disruptions, or commodity market shifts.
The ingredients that rank high on both measures deserve the closest watch. High-impact but stable items need regular, less frequent checks. Volatile but low-impact items can usually be monitored loosely.
Use ABC analysis to rank your ingredients
ABC analysis is a simple way to sort ingredients by how much they contribute to total spending. Here is how to do it -
1. Pull purchase data for a representative period, such as the last three months.
2. Calculate total spend for each ingredient (quantity purchased multiplied by price paid).
3. Rank ingredients from highest spend to lowest.
4. Calculate each item's share of total spending and add up the running percentage.
5. Divide the list into categories.
In general terms -
- A items are the small number of ingredients that account for roughly 70 to 80 percent of spending. These get the tightest monitoring.
- B items make up the next tier, around 15 to 20 percent of spending, and get moderate attention.
- C items are the long tail of ingredients that together account for only a small share of spending. These can be reviewed less often.
The exact percentages will vary by restaurant, but the pattern is usually the same - a short list of ingredients does most of the financial work.
Build a watch list
Turn your analysis into a practical tool by creating a watch list of your top 15 to 25 ingredients, sometimes called a "top 20" list. For each item, record -
- Current price and the price from one month and three months ago
- Percentage change over those periods
- Which menu items use it, and how heavily
- The supplier and any alternative sources
- Any known seasonal pattern
Review this list every week, ideally right after your main delivery day. Because it is short, the review takes minutes rather than hours, and it gives you an early read on the changes most likely to affect profitability.
Know which categories tend to be volatile
While every market is different, certain categories commonly deserve extra scrutiny -
1. Proteins, including beef, poultry, pork, and seafood, which can shift with feed costs, supply cycles, and demand
2. Dairy and eggs, which are subject to supply and seasonal changes
3. Cooking oils and fats, which follow commodity markets
4. Fresh produce, particularly items with short growing seasons or weather exposure
5. Imported goods, which can be affected by currency movements, tariffs, and shipping conditions
Alongside these, keep an eye on items that appear in many recipes, such as onions, flour, butter, or a house sauce base. A product that touches half your menu has an outsized effect even if its unit price seems low.
Once you know which ingredients are on your watch list, map each one to the dishes that use it. This allows you to answer an important question quickly when a price moves - which menu items just became less profitable, and by how much? If a cut of beef rises 12 percent, you should be able to see right away that three entrees and a sandwich are affected, and estimate the weekly impact based on how many of each you sell.
Your priority list is not permanent. Menu changes, new suppliers, seasonal specials, and shifts in what guests order will all change which ingredients matter most. Re-run your ABC analysis every quarter, or whenever you make major changes to the menu, so your attention stays pointed at the right items.
Update Recipe Costs on a Regular Schedule
Capturing new ingredient prices is only half the job. Those prices have to flow into your recipes, so that every plate cost reflects what you are paying today rather than what you paid when the dish was first costed. A recipe cost that is six months old is a historical record, not a management tool.
Translate price changes into plate costs
The mechanics are straightforward. When an ingredient price changes, recalculate its usable cost per recipe unit, using the same yield and conversion factors from your baseline. Then update every recipe that contains it. The new plate cost and food cost percentage follow automatically.
Consider a dish that uses 6 ounces of salmon. If the purchase price rises from 12.00 to 13.50 dollars per pound, and the yield is 90 percent, the usable cost goes from about 13.33 to 15.00 dollars per pound. The salmon portion moves from roughly 5.00 to 5.63 dollars, an increase of 63 cents on a single plate. If the dish is priced at 24 dollars, that alone pushes food cost up by more than two and a half percentage points. Seeing the effect in these terms makes the urgency of a price change much easier to judge than looking at the per-pound price alone.
Choose a cadence that matches the risk
Just as price recording frequency varies by ingredient, so does the frequency of recipe updates. A workable schedule looks like this -
1. Weekly - Recalculate the dishes that depend heavily on your watch-list ingredients, especially proteins, seafood, dairy, and seasonal produce.
2. Monthly - Refresh the full menu, so every recipe reflects current prices, including stable items that have drifted slowly.
3. Immediately - Update when a supplier announces a price increase, when you switch vendors, or when a product's size, grade, or yield changes.
4. Quarterly - Review the underlying recipe specifications themselves, including portion sizes, yields, and the ingredient list, to confirm the kitchen is still making the dish as costed.
Specials and limited-time dishes deserve special mention. They are often priced quickly and then forgotten, yet they frequently use premium or volatile ingredients. Cost them at the time of launch and again partway through their run.
Reduce manual work with automation
Manually recalculating dozens or hundreds of recipes is slow and invites errors, which is often why updates fall behind. Two approaches help -
1. Linked spreadsheets. If recipes reference a central ingredient price sheet rather than containing typed-in prices, changing one cell updates every recipe that uses it. This requires some setup but removes most of the repetitive work.
2. Costing software. Many platforms recalculate plate costs automatically whenever a new invoice price is entered or imported. They can also keep a history of each recipe's cost over time and highlight dishes whose costs have moved beyond a chosen threshold. For restaurants with large menus or multiple locations, this can save significant time and reduce the risk of stale data.
Whichever method you use, make sure the logic is transparent. Know how the system handles yield, conversions, and sub-recipes, such as house sauces or dressings, so that a change in a base ingredient correctly flows up into every dish that uses it.
Handle sub-recipes and prepared components
Many kitchens prepare components in-house, including stocks, sauces, doughs, marinades, and spice blends. These should be costed as their own recipes, with a cost per unit such as per ounce or per quart. Dishes then draw on that cost rather than on raw ingredients directly. When a base ingredient rises, the sub-recipe cost updates, and every dish using it updates in turn. Without this structure, it is easy to miss the indirect effect of a price change on items that never list the ingredient by name.
Each time you update a recipe cost, store the previous value along with the date. Over time, this creates a trend line for every dish, showing whether its plate cost has been flat, climbing steadily, or moving in seasonal swings. This history is what allows you to distinguish a temporary spike from a lasting shift, and it is the raw material for the early warning metrics covered next.
After each update cycle, scan the output for anything that looks off. A plate cost that jumps dramatically may reflect a genuine market move, but it could also signal a data entry error, a wrong unit conversion, or a mismatched pack size. Verify unusual changes against the original invoice before acting on them.
Translate price changes into plate costs
The mechanics are straightforward. When an ingredient price changes, recalculate its usable cost per recipe unit, using the same yield and conversion factors from your baseline. Then update every recipe that contains it. The new plate cost and food cost percentage follow automatically.
Consider a dish that uses 6 ounces of salmon. If the purchase price rises from 12.00 to 13.50 dollars per pound, and the yield is 90 percent, the usable cost goes from about 13.33 to 15.00 dollars per pound. The salmon portion moves from roughly 5.00 to 5.63 dollars, an increase of 63 cents on a single plate. If the dish is priced at 24 dollars, that alone pushes food cost up by more than two and a half percentage points. Seeing the effect in these terms makes the urgency of a price change much easier to judge than looking at the per-pound price alone.
Choose a cadence that matches the risk
Just as price recording frequency varies by ingredient, so does the frequency of recipe updates. A workable schedule looks like this -
1. Weekly - Recalculate the dishes that depend heavily on your watch-list ingredients, especially proteins, seafood, dairy, and seasonal produce.
2. Monthly - Refresh the full menu, so every recipe reflects current prices, including stable items that have drifted slowly.
3. Immediately - Update when a supplier announces a price increase, when you switch vendors, or when a product's size, grade, or yield changes.
4. Quarterly - Review the underlying recipe specifications themselves, including portion sizes, yields, and the ingredient list, to confirm the kitchen is still making the dish as costed.
Specials and limited-time dishes deserve special mention. They are often priced quickly and then forgotten, yet they frequently use premium or volatile ingredients. Cost them at the time of launch and again partway through their run.
Reduce manual work with automation
Manually recalculating dozens or hundreds of recipes is slow and invites errors, which is often why updates fall behind. Two approaches help -
1. Linked spreadsheets. If recipes reference a central ingredient price sheet rather than containing typed-in prices, changing one cell updates every recipe that uses it. This requires some setup but removes most of the repetitive work.
2. Costing software. Many platforms recalculate plate costs automatically whenever a new invoice price is entered or imported. They can also keep a history of each recipe's cost over time and highlight dishes whose costs have moved beyond a chosen threshold. For restaurants with large menus or multiple locations, this can save significant time and reduce the risk of stale data.
Whichever method you use, make sure the logic is transparent. Know how the system handles yield, conversions, and sub-recipes, such as house sauces or dressings, so that a change in a base ingredient correctly flows up into every dish that uses it.
Handle sub-recipes and prepared components
Many kitchens prepare components in-house, including stocks, sauces, doughs, marinades, and spice blends. These should be costed as their own recipes, with a cost per unit such as per ounce or per quart. Dishes then draw on that cost rather than on raw ingredients directly. When a base ingredient rises, the sub-recipe cost updates, and every dish using it updates in turn. Without this structure, it is easy to miss the indirect effect of a price change on items that never list the ingredient by name.
Each time you update a recipe cost, store the previous value along with the date. Over time, this creates a trend line for every dish, showing whether its plate cost has been flat, climbing steadily, or moving in seasonal swings. This history is what allows you to distinguish a temporary spike from a lasting shift, and it is the raw material for the early warning metrics covered next.
After each update cycle, scan the output for anything that looks off. A plate cost that jumps dramatically may reflect a genuine market move, but it could also signal a data entry error, a wrong unit conversion, or a mismatched pack size. Verify unusual changes against the original invoice before acting on them.
Simplify Your Statements
Streamline Your Finances with Altametrics
Identify Margin Erosion Early with Key Metrics

Up-to-date recipe costs tell you what each dish costs to make. The next step is turning that information into signals that show when profitability is slipping, ideally while there is still time to respond. A handful of well-chosen metrics, reviewed on a regular schedule, can do this far better than scanning a monthly profit and loss statement.
Theoretical versus actual food cost
The most important comparison in restaurant cost control is between what your food cost should be and what it actually is.
Theoretical food cost is calculated from your recipes and sales data. Multiply the plate cost of each item by the number sold, add it all up, and divide by total food sales. It represents the cost you would have if every portion were made exactly to spec, with no waste, spoilage, or error.
Actual food cost is calculated from your inventory and purchases -
Actual food cost = Beginning inventory + Purchases - Ending inventory
Divide that figure by food sales to get the percentage.
The gap between the two is your variance. A small gap is normal, since some waste and prep loss are unavoidable. A widening gap points to problems such as over-portioning, spoilage, theft, receiving errors, unrecorded comps, or outdated recipe costs. If the theoretical number itself is rising, the cause is more likely ingredient price changes. Looking at both together helps you tell whether the issue is rising prices, kitchen execution, or both.
Plate cost and food cost percentage trends
For each menu item, track plate cost and food cost percentage over time rather than looking at a single reading. A dish that moves from 29 to 31 to 33 percent over three months is telling you something that one snapshot never would. Chart these trends for your highest-volume and highest-spend items first.
When reviewing, ask -
- Is the change steady, seasonal, or a sudden jump?
- Has it been sustained across several update cycles?
- Is it driven by one ingredient or several?
Direction matters as much as level. A dish still within target but trending steadily upward deserves attention before it crosses the line.
Contribution margin per item
Food cost percentage can be misleading on its own. A high-priced dish with a higher percentage may still earn more actual dollars per plate than a cheaper dish with a lower one. That is why it helps to track contribution margin, which is the menu price minus the plate cost (and any other direct variable costs you choose to include).
For example, a 9 dollar appetizer at 25 percent food cost leaves 6.75 dollars per plate, while a 28 dollar entree at 35 percent leaves 18.20 dollars. Watching how contribution margin changes over time shows the real dollar impact of cost increases, and it connects directly to how much each sale contributes toward covering labor, rent, and profit.
Set variance thresholds that trigger a review
Metrics only help if they prompt action. Decide in advance what level of change requires a response, so reviews are consistent rather than ad hoc. Examples include -
- An ingredient price moving more than a set percentage, such as 5 percent, from the last recorded price
- A dish's food cost percentage exceeding its target by a set number of points
- Actual food cost rising above theoretical by more than an agreed margin
- A menu item's contribution margin falling below a minimum dollar amount
The right thresholds depend on your concept, volumes, and margins. Start with reasonable limits, then adjust as you learn how much normal fluctuation your business experiences. Tighter thresholds suit high-volume and high-cost items, while looser ones are fine for minor ingredients.
Use alerts where you can
If your costing software supports alerts, configure them against these thresholds so that a significant price change or an out-of-range dish is flagged automatically. In a spreadsheet, conditional formatting can highlight cells that cross a limit. Either way, the goal is to make problems visible without having to hunt for them.
Read trends, not single data points
One unusual week is not necessarily a problem. Produce prices spike and settle, a delivery might include a one-time surcharge, and inventory counts can be slightly off. To avoid overreacting, look at rolling averages over several weeks and compare against the same period in previous years where possible, to account for seasonality. A single reading should prompt a question, while a sustained pattern should prompt action.
Build a simple dashboard
Pull these measures into a one-page summary reviewed weekly or at least monthly. A useful version might include -
- Theoretical versus actual food cost for the period
- Your top watch-list ingredients and their price changes
- Dishes outside their target food cost percentage
- The items with the largest drop in contribution margin
- Estimated weekly dollar impact of recent price increases
A short, consistent review is far more effective than a long, occasional one. Keeping it brief makes it more likely to happen, and regular reviews are what turn data into early warning.
Theoretical versus actual food cost
The most important comparison in restaurant cost control is between what your food cost should be and what it actually is.
Theoretical food cost is calculated from your recipes and sales data. Multiply the plate cost of each item by the number sold, add it all up, and divide by total food sales. It represents the cost you would have if every portion were made exactly to spec, with no waste, spoilage, or error.
Actual food cost is calculated from your inventory and purchases -
Actual food cost = Beginning inventory + Purchases - Ending inventory
Divide that figure by food sales to get the percentage.
The gap between the two is your variance. A small gap is normal, since some waste and prep loss are unavoidable. A widening gap points to problems such as over-portioning, spoilage, theft, receiving errors, unrecorded comps, or outdated recipe costs. If the theoretical number itself is rising, the cause is more likely ingredient price changes. Looking at both together helps you tell whether the issue is rising prices, kitchen execution, or both.
Plate cost and food cost percentage trends
For each menu item, track plate cost and food cost percentage over time rather than looking at a single reading. A dish that moves from 29 to 31 to 33 percent over three months is telling you something that one snapshot never would. Chart these trends for your highest-volume and highest-spend items first.
When reviewing, ask -
- Is the change steady, seasonal, or a sudden jump?
- Has it been sustained across several update cycles?
- Is it driven by one ingredient or several?
Direction matters as much as level. A dish still within target but trending steadily upward deserves attention before it crosses the line.
Contribution margin per item
Food cost percentage can be misleading on its own. A high-priced dish with a higher percentage may still earn more actual dollars per plate than a cheaper dish with a lower one. That is why it helps to track contribution margin, which is the menu price minus the plate cost (and any other direct variable costs you choose to include).
For example, a 9 dollar appetizer at 25 percent food cost leaves 6.75 dollars per plate, while a 28 dollar entree at 35 percent leaves 18.20 dollars. Watching how contribution margin changes over time shows the real dollar impact of cost increases, and it connects directly to how much each sale contributes toward covering labor, rent, and profit.
Set variance thresholds that trigger a review
Metrics only help if they prompt action. Decide in advance what level of change requires a response, so reviews are consistent rather than ad hoc. Examples include -
- An ingredient price moving more than a set percentage, such as 5 percent, from the last recorded price
- A dish's food cost percentage exceeding its target by a set number of points
- Actual food cost rising above theoretical by more than an agreed margin
- A menu item's contribution margin falling below a minimum dollar amount
The right thresholds depend on your concept, volumes, and margins. Start with reasonable limits, then adjust as you learn how much normal fluctuation your business experiences. Tighter thresholds suit high-volume and high-cost items, while looser ones are fine for minor ingredients.
Use alerts where you can
If your costing software supports alerts, configure them against these thresholds so that a significant price change or an out-of-range dish is flagged automatically. In a spreadsheet, conditional formatting can highlight cells that cross a limit. Either way, the goal is to make problems visible without having to hunt for them.
Read trends, not single data points
One unusual week is not necessarily a problem. Produce prices spike and settle, a delivery might include a one-time surcharge, and inventory counts can be slightly off. To avoid overreacting, look at rolling averages over several weeks and compare against the same period in previous years where possible, to account for seasonality. A single reading should prompt a question, while a sustained pattern should prompt action.
Build a simple dashboard
Pull these measures into a one-page summary reviewed weekly or at least monthly. A useful version might include -
- Theoretical versus actual food cost for the period
- Your top watch-list ingredients and their price changes
- Dishes outside their target food cost percentage
- The items with the largest drop in contribution margin
- Estimated weekly dollar impact of recent price increases
A short, consistent review is far more effective than a long, occasional one. Keeping it brief makes it more likely to happen, and regular reviews are what turn data into early warning.
Use Menu Engineering to Interpret the Data
Cost data tells you what each dish costs and how those costs are changing. It does not tell you how much each dish matters to the business. A dish with rising costs that sells twice a week is a minor concern, while a modest increase on your best seller can be a serious one. Menu engineering brings cost and sales data together so you can see which items deserve action first.
The core idea - profitability and popularity
Menu engineering evaluates each item on two measures -
- Profitability, usually measured by contribution margin (menu price minus plate cost)
- Popularity, measured by sales mix, which is the share of total items sold that each dish represents
Comparing each item against the menu's average on both measures sorts every dish into one of four categories.
The four categories
1. High profit, high popularity. These are your core performers. They earn well and sell well. The priority here is protection - monitor their ingredient costs closely, keep recipes and portions consistent, and avoid changes that might hurt their appeal.
2. High profit, low popularity. These dishes earn well per plate but are not selling as much as they could. They may benefit from better menu placement, clearer descriptions, server recommendations, or featuring as a special. The opportunity is to sell more of them.
3. Low profit, high popularity. These are the items most exposed to margin erosion. Guests love them, so they sell in volume, but each plate earns relatively little. Even a small cost increase multiplied by high volume does real damage. They are usually the first candidates for cost reduction, recipe adjustments, or careful price increases.
4. Low profit, low popularity. These items neither earn much nor sell much. Consider reworking them, replacing them, or removing them to make room for stronger dishes and simplify purchasing.
Many operators use playful names for these groups, but the labels matter less than the logic. What counts is that each category points to a different kind of response.
How to run the analysis
1. Pull sales data for a representative period, such as the last one to three months, showing units sold for each item.
2. Calculate each item's current plate cost and contribution margin, using your updated recipe costs.
3. Calculate the average contribution margin across the menu, weighted by units sold.
4. Calculate each item's sales mix percentage and compare it against a popularity benchmark. A common rule of thumb is 70 percent of the share you would expect if all items sold equally. For a menu with 10 items in a category, that would be 7 percent.
5. Classify each item as above or below average on each measure, and place it in one of the four groups.
Run the analysis within categories, such as appetizers, entrees, and desserts, rather than across the whole menu. Comparing a side dish to a steak is not meaningful.
Menu engineering is only as accurate as the costs feeding it. If you run the analysis using old plate costs, an item may appear to be a strong performer when its margin has actually shrunk. This is one reason the earlier steps matter - regular cost updates keep the classification honest. Re-run the analysis whenever costs change meaningfully, and at least quarterly. An item can migrate from one category to another over time, and noticing that movement is itself an early warning sign.
When prioritizing, estimate the total weekly or monthly dollar impact of each issue. Multiply the change in contribution margin per plate by the number of plates sold. A small per-plate loss on a top seller can easily outweigh a larger loss on a rarely ordered dish. Ranking problems by total dollar impact keeps your effort focused on the items that influence profit most.
Some items are valuable for reasons beyond their own margin. A lower-margin dish may draw guests in, anchor the menu, or lead to higher-margin drinks and desserts. Before cutting or repricing, think about the role each item plays. The goal is not to maximize every dish in isolation but to improve the profitability of the menu as a whole without damaging what guests value.
Changes made in response to the analysis, such as repositioning items, rewriting descriptions, or adjusting prices, should be made thoughtfully. Guests notice when portions shrink or quality slips, so favor changes that protect the experience while improving the numbers. The most effective responses are often subtle and well-targeted.
The core idea - profitability and popularity
Menu engineering evaluates each item on two measures -
- Profitability, usually measured by contribution margin (menu price minus plate cost)
- Popularity, measured by sales mix, which is the share of total items sold that each dish represents
Comparing each item against the menu's average on both measures sorts every dish into one of four categories.
The four categories
1. High profit, high popularity. These are your core performers. They earn well and sell well. The priority here is protection - monitor their ingredient costs closely, keep recipes and portions consistent, and avoid changes that might hurt their appeal.
2. High profit, low popularity. These dishes earn well per plate but are not selling as much as they could. They may benefit from better menu placement, clearer descriptions, server recommendations, or featuring as a special. The opportunity is to sell more of them.
3. Low profit, high popularity. These are the items most exposed to margin erosion. Guests love them, so they sell in volume, but each plate earns relatively little. Even a small cost increase multiplied by high volume does real damage. They are usually the first candidates for cost reduction, recipe adjustments, or careful price increases.
4. Low profit, low popularity. These items neither earn much nor sell much. Consider reworking them, replacing them, or removing them to make room for stronger dishes and simplify purchasing.
Many operators use playful names for these groups, but the labels matter less than the logic. What counts is that each category points to a different kind of response.
How to run the analysis
1. Pull sales data for a representative period, such as the last one to three months, showing units sold for each item.
2. Calculate each item's current plate cost and contribution margin, using your updated recipe costs.
3. Calculate the average contribution margin across the menu, weighted by units sold.
4. Calculate each item's sales mix percentage and compare it against a popularity benchmark. A common rule of thumb is 70 percent of the share you would expect if all items sold equally. For a menu with 10 items in a category, that would be 7 percent.
5. Classify each item as above or below average on each measure, and place it in one of the four groups.
Run the analysis within categories, such as appetizers, entrees, and desserts, rather than across the whole menu. Comparing a side dish to a steak is not meaningful.
Menu engineering is only as accurate as the costs feeding it. If you run the analysis using old plate costs, an item may appear to be a strong performer when its margin has actually shrunk. This is one reason the earlier steps matter - regular cost updates keep the classification honest. Re-run the analysis whenever costs change meaningfully, and at least quarterly. An item can migrate from one category to another over time, and noticing that movement is itself an early warning sign.
When prioritizing, estimate the total weekly or monthly dollar impact of each issue. Multiply the change in contribution margin per plate by the number of plates sold. A small per-plate loss on a top seller can easily outweigh a larger loss on a rarely ordered dish. Ranking problems by total dollar impact keeps your effort focused on the items that influence profit most.
Some items are valuable for reasons beyond their own margin. A lower-margin dish may draw guests in, anchor the menu, or lead to higher-margin drinks and desserts. Before cutting or repricing, think about the role each item plays. The goal is not to maximize every dish in isolation but to improve the profitability of the menu as a whole without damaging what guests value.
Changes made in response to the analysis, such as repositioning items, rewriting descriptions, or adjusting prices, should be made thoughtfully. Guests notice when portions shrink or quality slips, so favor changes that protect the experience while improving the numbers. The most effective responses are often subtle and well-targeted.
Get Accurate Inventory Valuations
Manage Your Workforce with Altametrics
Frequently
Asked Questions
What is the weighted average ingredient costing?
Weighted average costing calculates an ingredient's average purchase price based on the quantities purchased at different prices. It helps restaurants account for price fluctuations instead of relying exclusively on the latest invoice.
What tools can restaurants use to track recipe costs?
Restaurants can use spreadsheets, recipe costing software, and inventory management systems to monitor ingredient prices, calculate recipe expenses, maintain historical cost records, and identify changes affecting food cost percentages.
How can restaurant owners prevent outdated recipe costs?
Establish a regular review schedule, maintain updated supplier pricing records, standardize ingredient measurements, and recalculate recipe costs whenever significant purchasing or recipe changes occur.
How can restaurant owners identify recipes with rising costs?
Compare current recipe costs against historical calculations, monitor ingredient price changes, and review cost per serving. Recipes with consistently increasing costs or declining margins should receive priority for further evaluation.
Must-Read Content

How to Calculate Cost of Sales for a Restaurant
Learn how to calculate restaurant cost of sales using inventory, purchases, and closing stock to monitor expenses, control food costs, and protect profitability.

Restaurant Cash Handling Procedures
Consistent cash handling procedures help restaurants prevent errors and theft by standardizing opening, payments, counting, closing, deposits, training, and regular audits.

How to Manage Restaurant Finances
Learn how to manage restaurant finances through budgeting, cost control, cash flow management, financial tracking, reporting, and technology.